The Origins of Auction Market Theory
Auction Market Theory's roots can be traced back to the Chicago Board of Trade (CBOT) in the 1980s, where it was developed by statistician J. Peter Steidlmayer. He was faced with a problem — a problem that all pit traders faced at the time: how do you objectively understand what the market is doing in real time?
His conclusion? Price alone doesn't tell the full story. Time and volume do.
This insight gave birth to the Market Profile — a visual framework that organized price, time, and volume into a structure that reflected how markets actually function: as two-sided auctions. The Market Profile became the fundamental tool through which Auction Market Theory was expressed, later refined into what we know today as the Volume Profile.
The principles became more widely known and refined through the teachings of Jim Dalton and his book Markets in Profile — still considered essential reading for any serious futures trader.
What Is Auction Market Theory?
At its core, Auction Market Theory is a philosophy that explains market movement. It's not a strategy in itself — but it gives traders the foundational understanding of why markets move, which is the prerequisite for developing any edge and strategy that holds up over time.
Every market is an auction. At every moment, buyers and sellers compete to transact. Price is the mechanism used to facilitate that process. Price doesn't move randomly — it moves with purpose: to identify where fair value is located.
"The market is always trying to answer one simple question: what is the market trying to do, and is it succeeding?"
This gives traders two fundamental states that the market is always in:
Balance (Fair Value)
Price is accepted. Value is agreed upon, and the market rotates within a range, building volume at fair value. Neither side has conviction. This is where price spends 70–80% of its time — always getting attracted back to balance. It's the market's "safe zone."
Imbalance (Unfair Value)
When one side of the auction is overwhelmed, the auction breaks and we see an expansion. Price moves quickly, searching for new participants, and eventually re-establishes fair value elsewhere. These are the directional trend moves in the market.
Volume is the confirmation layer. Price tells you where the auction happened. Volume tells you how much conviction was behind it. High volume at a level signals acceptance, value, and potential support or resistance. Low volume signals rejection, inefficiency, and a magnet for future price revisit.
This is the engine behind the two core principles of AMT:
- Volume moves price — price cannot sustain a move without participation. Volume is the fuel. Where volume accumulates, price gravitates. Where volume is absent, price moves fast and tends to return.
- Balance and imbalance drive market structure — markets alternate between building value (balance) and breaking away from it (imbalance). Every trend is just the market searching for the next area of accepted value. Every consolidation is the market digesting the move and deciding its next auction direction.
Once price moves outside an area of balance, it becomes "unfair value" and has exactly two options: revert back into balance, or expand continuously in search of a new balance area. Understanding which one is happening — and why — is what AMT gives you.
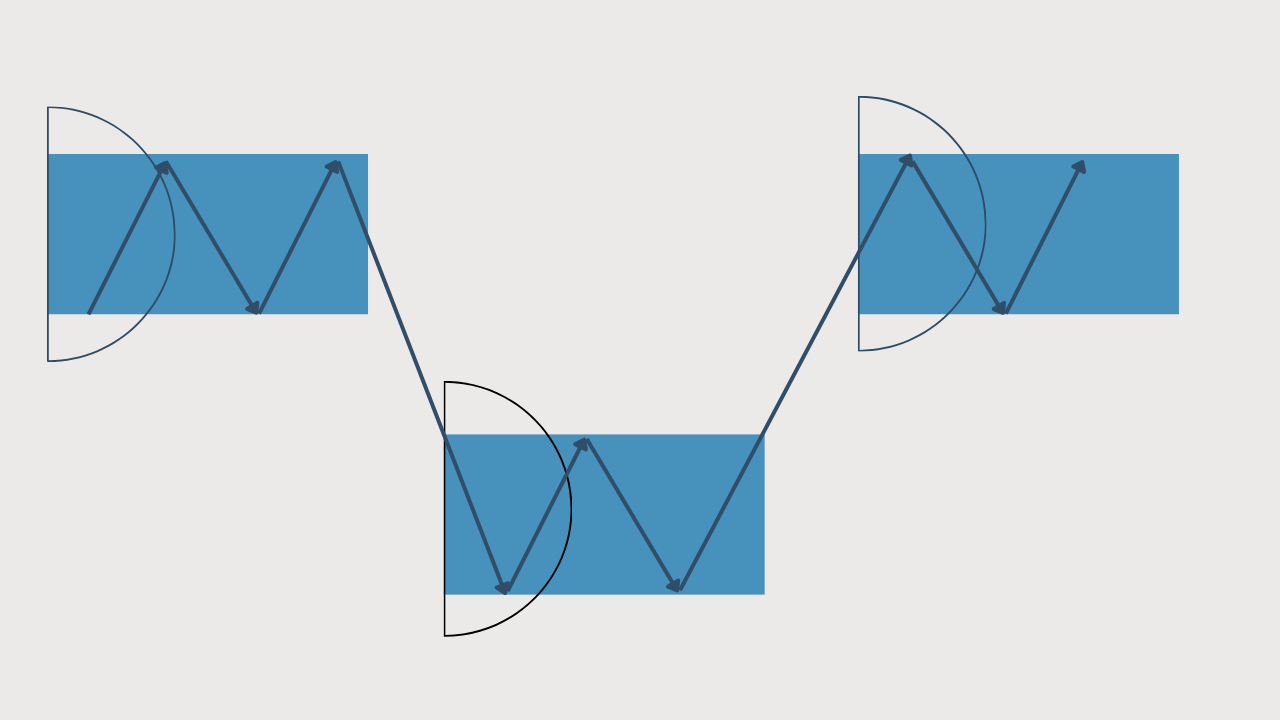
Price alternates between balance (acceptance) and imbalance (expansion) — the two fundamental states of AMT
Why AMT Is the Foundation of Professional Futures Trading
AMT is not popular in retail trading circles because it requires genuine understanding rather than a simple indicator signal. That's precisely why it works. Here's what it gives serious traders that nothing else does:
It Removes Subjectivity
AMT isn't based on indicators, patterns, or anything that creates guesswork. It's rooted in how markets actually function. Balance and imbalance are objective conditions you can observe directly through price structure and volume distribution. If price is in an upper balance, the expectation is bullish continuation — and that expectation holds until price proves it wrong.
It Defines Context Before Entry
Through volume profile analysis, AMT tells you the directionality of the market and its overall context before the market opens. Are we inside a balance? How did we arrive there — from above or below? Those two questions alone give you a directional lean before price moves a single tick. Entries without context are gambles.
It Explains Why Levels Matter
Areas of interest in AMT are based on volume, not arbitrary lines on a chart. High volume nodes are where markets built value and spent the most time — genuine support and resistance. Low volume nodes are gaps in the auction that price will revisit. That's a fundamentally better reason to trade a level than "it held here before."
It Works Across All Timeframes and Instruments
Because AMT is based on the mechanics of markets themselves — not any specific asset's quirks — it applies equally to ES, NQ, crude oil, bonds, or equities. The auction mechanism never changes. Only the participants do.
It Integrates Directly with Order Flow
AMT gives you the why and the where. Order flow — DOM, footprint charts, delta — gives you the when and the how. Together they form a complete trading methodology: AMT defines the structure and context, order flow confirms the execution. This is the foundation of the EDGE Trading System deployed daily at Paralia Trading Desk.
The Volume Profile: How to Visualize AMT
The best tool to read and understand AMT in practice is the Volume Profile — a histogram that shows how much volume traded at each price level over a given period. It makes the auction visible. Instead of just seeing where price went, you can see where it spent time and traded heavily, revealing where the market accepted value.
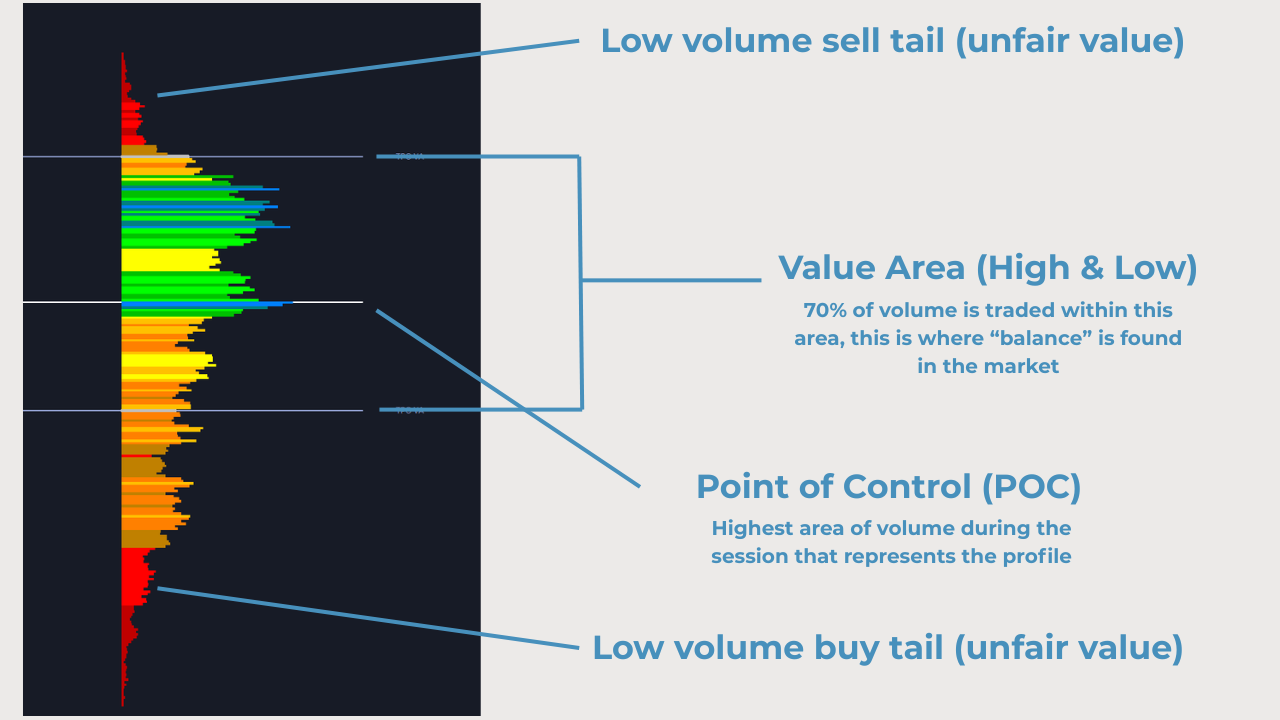
The Volume Profile originates from the Gaussian Bell Curve — the majority of values are represented in the first standard deviation (the value area). The further you move from that center, the more extreme and unsustainable the price becomes. Understanding this shape is central to reading the market correctly.
Point of Control (POC)
The price level with the highest volume over the period — the market's fairest price. Acts as a gravitational center; when price is away from the POC with no directional conviction, there's an inherent pull back. Use it as a magnet target, a bias reference (above = buyer control, below = seller control), and a reaction zone on retest.
Value Area (VA)
The price range containing 70% of all traded volume, bounded by the Value Area High (VAH) and Value Area Low (VAL). Defines accepted value — price inside is in balance, price outside is contested. Key application: the 80% Rule — if price opens outside the VA and re-enters, it tends to rotate to the opposite boundary.
High Volume Node (HVN)
A peak in the profile — a zone of heavy two-sided participation where fair value was established. These levels have memory; the market returns to them and slows down. Use HVNs as support/resistance zones, as profit targets when trending through thin areas, and as zones to avoid initiating trades given the choppy, balanced nature of price inside them.
Low Volume Node (LVN)
A valley in the profile — price moved through quickly with minimal participation, leaving an incomplete auction. LVNs are areas of least resistance; price accelerates through them and is drawn back to them. Use them to anticipate fast moves on breakouts, as clear boundaries for failure signals, and as pullback entry zones in trending conditions.
Sierra Chart volume profile: POC, Value Area, and the low-volume tails that mark key trade levels
The volume profile from Sierra Chart is read as a heatmap: the POC is the highest level of volume (dark blue), with green representing 60–80% of POC volume and red representing the lowest 0–10%. The ledge drop-offs from HVN areas into LVN areas are your key trade levels — where strong-handed market participants get active to move prices.
The 7 AMT Principles of Market Movement
There are seven principles of Auction Market Theory based on the volume profile that help traders understand direction and market movement. Together, they form the analytical framework for developing a daily trade plan and identifying the highest-probability setups — which is the core component of the EDGE Trading System.
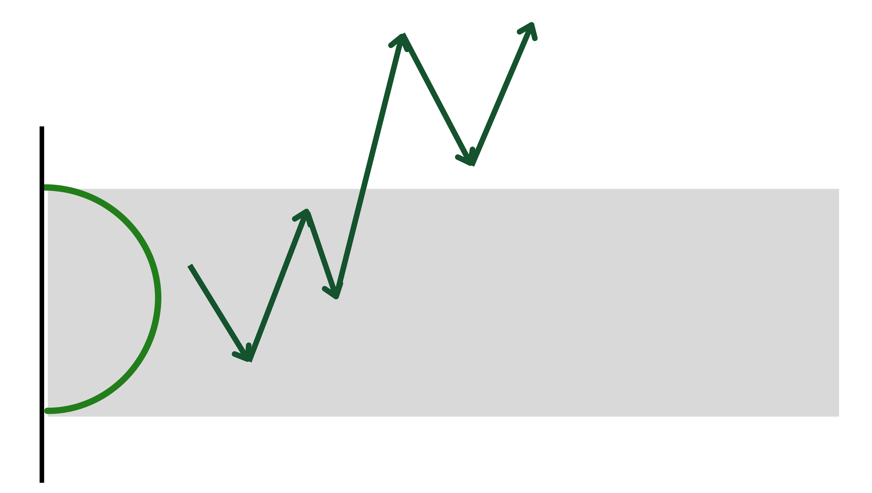
Price Enters an Area of Balance
When price enters a balance area, the default expectation is that it wants to stay there. Direction is set by how it arrived: entering from above is bearish momentum, from below is bullish. From there, price targets the opposite extreme of the balance. The first test of that extreme after entry is the ideal trade location. Once price reaches the other end, raise caution — watch for HH/HL or LL/LH structure to confirm the trend is holding within the range.
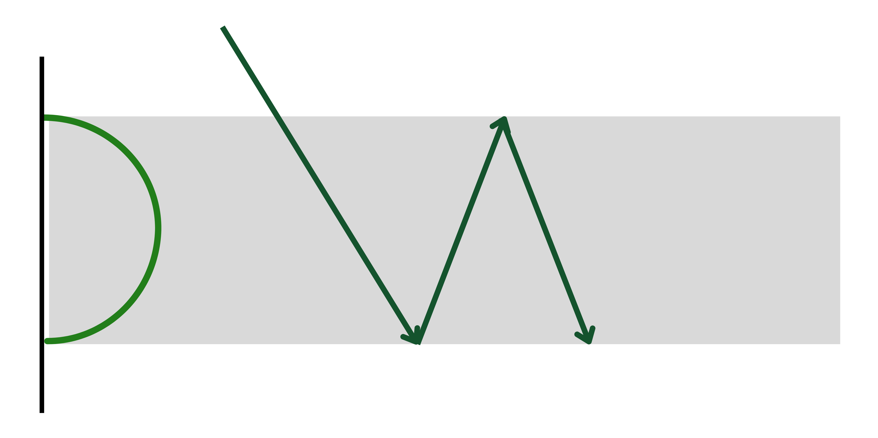
Principle 1 in action: price enters from above, sets a bearish bias, and targets the lower extreme of the range
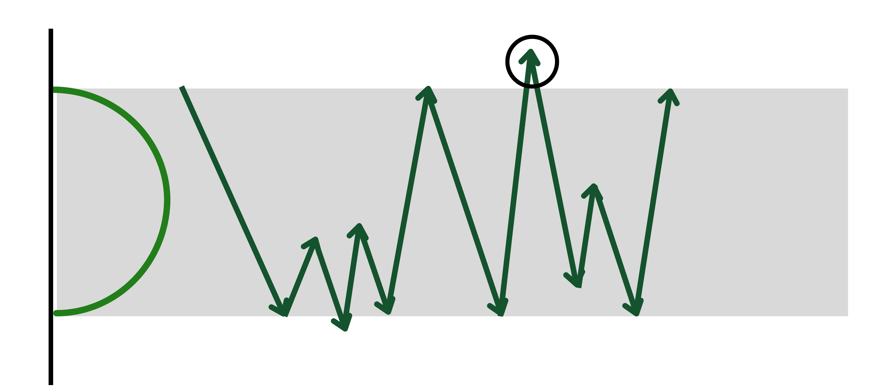
Price Is Inside a Balance
Once inside, assume balance until price clearly expands outside. Immediate directional bias comes from the most recent move — whether that's a genuine breakout or a head fake. A temporary dip below the balance low that snaps back is buy strength. A temporary pop above the balance high that fades is sell strength. Expect choppier, lower-quality price action — especially in smaller balance areas.
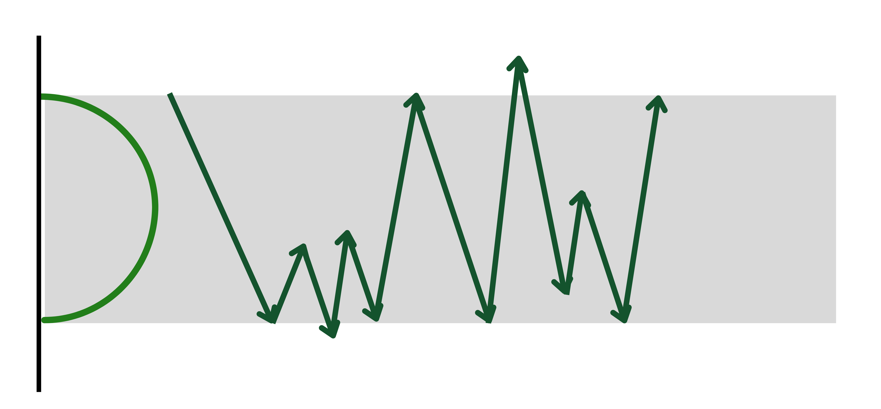
Inside balance: choppy rotation between the extremes — the expectation is range until price expands clearly outside
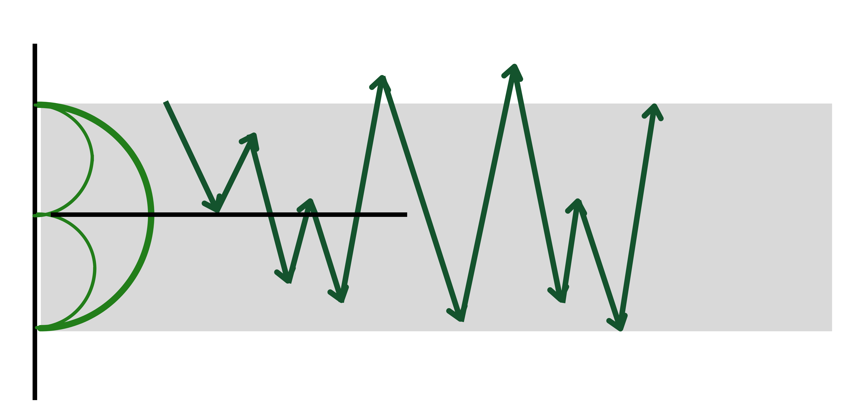
Price Is Outside of Balance
Outside of balance, the bias is continuation in that direction. Price is searching for new value or building a new balance higher or lower. On pullbacks, expect price to hold the extreme it just broke from — balance top acts as support in a bullish break, balance bottom as resistance in a bearish one. The real confirmation of continuation is price making a higher high from the extreme, not just retesting it.
Outside balance: directional bias is continuation — pullbacks to the breakout extreme are the entry opportunity
Two Questions to Always Ask
Where does the market want to go? If price is moving into a balance, the direction it came from is the bias. If price head-faked outside and returned, the move back inside is the new bias. If price is already outside a balance, the bias is trend continuation.
How well is it doing that job? Track HH/HL in bullish moves, LL/LH in bearish ones. Too many tests of the same level without a new high or low is a warning sign. The first test of support or resistance is critical — watch for the head fake before continuation.
The head fake: price briefly breaches a level before snapping back — the critical signal to watch before committing to continuation
Minor Areas Within a Balance
Real-world profiles aren't clean bell curves — they're jagged, with smaller sub-balances embedded inside larger ones. These minor areas act as internal guideposts: targets, support, and resistance as price works through the range. If the broader move is bearish and price enters from above, a minor area below can act as support. If that minor support breaks, it flips to resistance. A momentum reclaim back above it is a potential higher-low signal.
Minor areas within balance: sub-balances act as internal targets and inflection points as price works through the range
Price Moves Toward Other Balances
When price breaks from one balance, it targets the next. The confirmation of trend strength is price actually entering that new balance — not just reaching toward it. The ideal continuation is holding the accepted extreme of the new balance. If price fails to hold inside the new balance and pulls back to the top of the prior one, that's the last-chance entry for the trend. If it breaks back into the prior balance entirely, that's a structural flip.
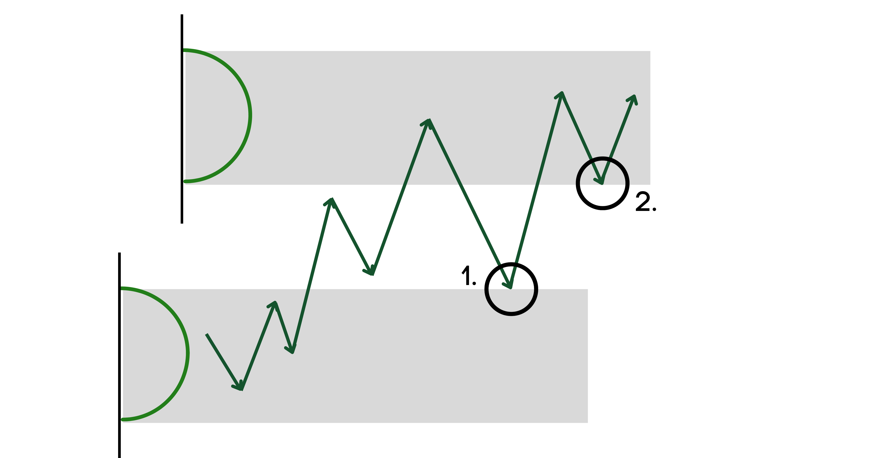
Price moves toward other balances: the new balance extreme becomes the confirmation level — holding there signals trend continuation
Balance Is Time-Sensitive
The first test of a balance extreme after entry is the highest-probability trade. The longer price spends inside the balance without making new highs (in a bullish structure), the higher the probability of a break back in the opposite direction. Failure to make a new high on the first or second test shifts the lean bearish — the only buy at that point is a head fake below support that reclaims back within the balance. Otherwise, you're buying into a structural transition, not a continuation.

Balance is time-sensitive: repeated failures to make a new high shift the lean — you're no longer buying continuation, you're buying a structural transition
Different Volume Profiles and How to Use Them
Reading the volume profile is just one part of AMT. The core concept is to identify where major balances are, then understand where price is in relation to those balances and how it arrived there. There are two primary ways to navigate markets through volume profile analysis.
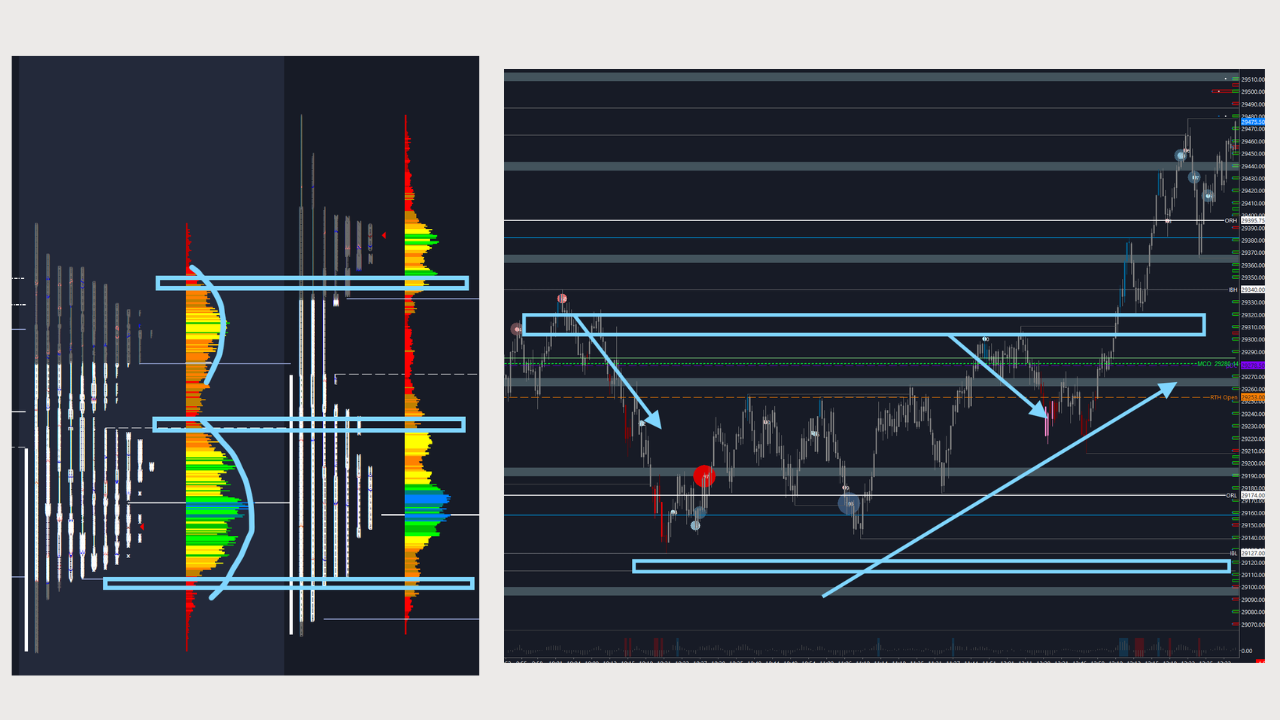
1. Composite Profiles — The Macro View
Composite profiles are built from several days, weeks, or months of volume data to establish where the largest balances are. These large balances produce key extremes — the large ledge drop-offs that turn into Low Volume Nodes to trade from. These are your macro trade levels: the areas where strong-handed market participants have historically gotten active to move prices.
For example: a 200-day composite profile overlaid with a weekly profile reveals where the market has repeatedly built value and where the major structural voids are. Tops and bottoms of those large balance zones become the primary areas of interest for directional bias.
To deploy AMT to a composite view, understand where price currently sits and how it got there. If price is in an upper balance and came from above, the lean is bearish — sell rallies into the balance high to see if price can move through the minor balances and levels within, targeting the lower extreme.
To deploy AMT to this chart, we need to understand where price is and how it got to that point. This is a Nasdaq futures composite profile — if price is in the higher balance, between 29,120 and 29,440, and we came from above that balance, we want to lean on the sell side.
This creates a directionally bearish bias where we want to sell rallies into the 29,440 area to see if we can move through the minor balances and levels within. The ledges we trade from are the areas where the volume profile creates the largest drop-off from the HVN area. These extremes are where strong-handed market participants get active to move prices.
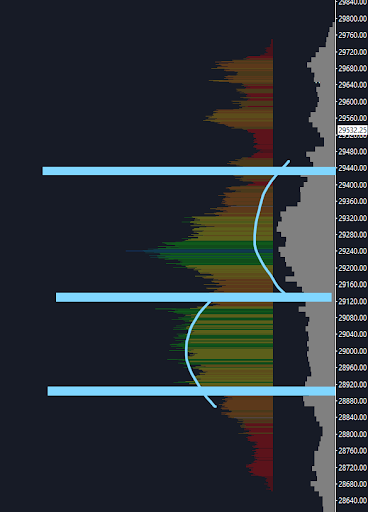
NQ composite profile (weekly + 200-day): upper balance between 29,120–29,440 with a bearish lean — sell rallies to the HVN ledge extremes
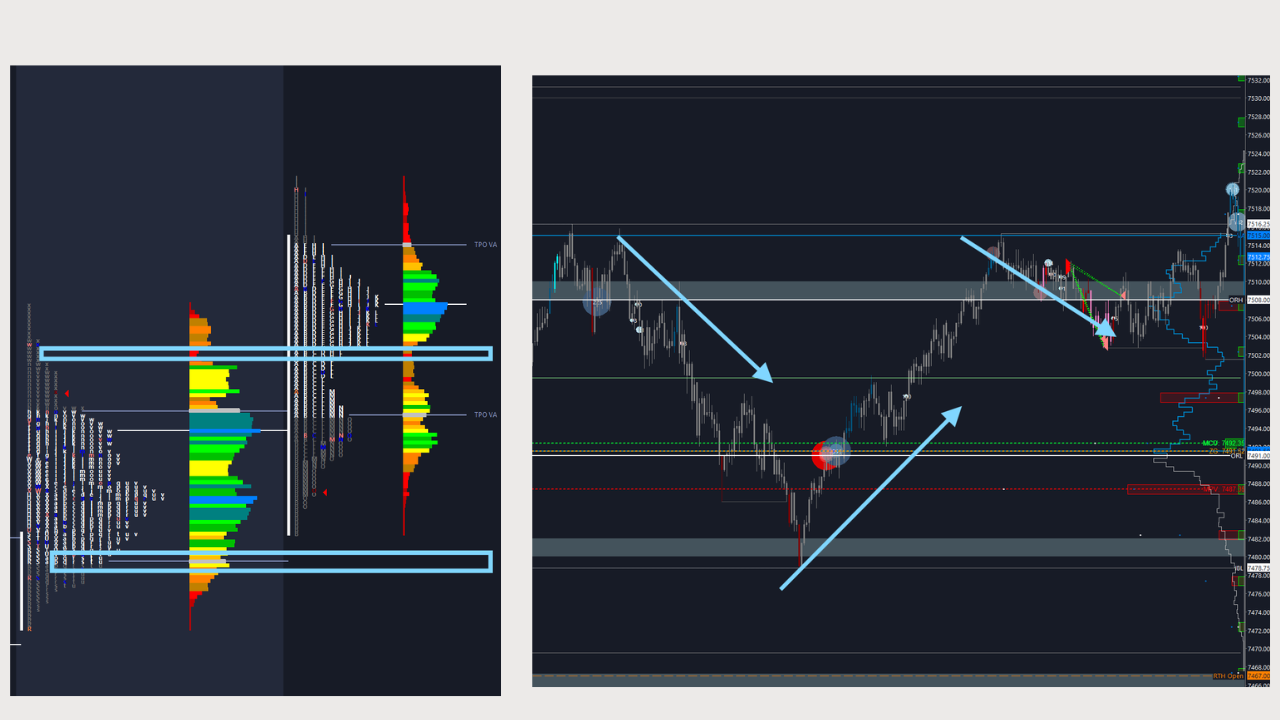
2. Session Profiles — The Daily View
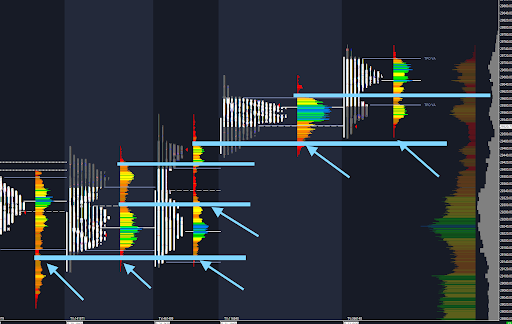
Individual session profiles reveal where each day's auction built balance and where the LVN ledges sit. Prior session balances and their ledge extremes become the areas of interest for the following session. As price navigates through balances to the upside over multiple sessions, buy ledges on pullbacks become the primary trade opportunity.
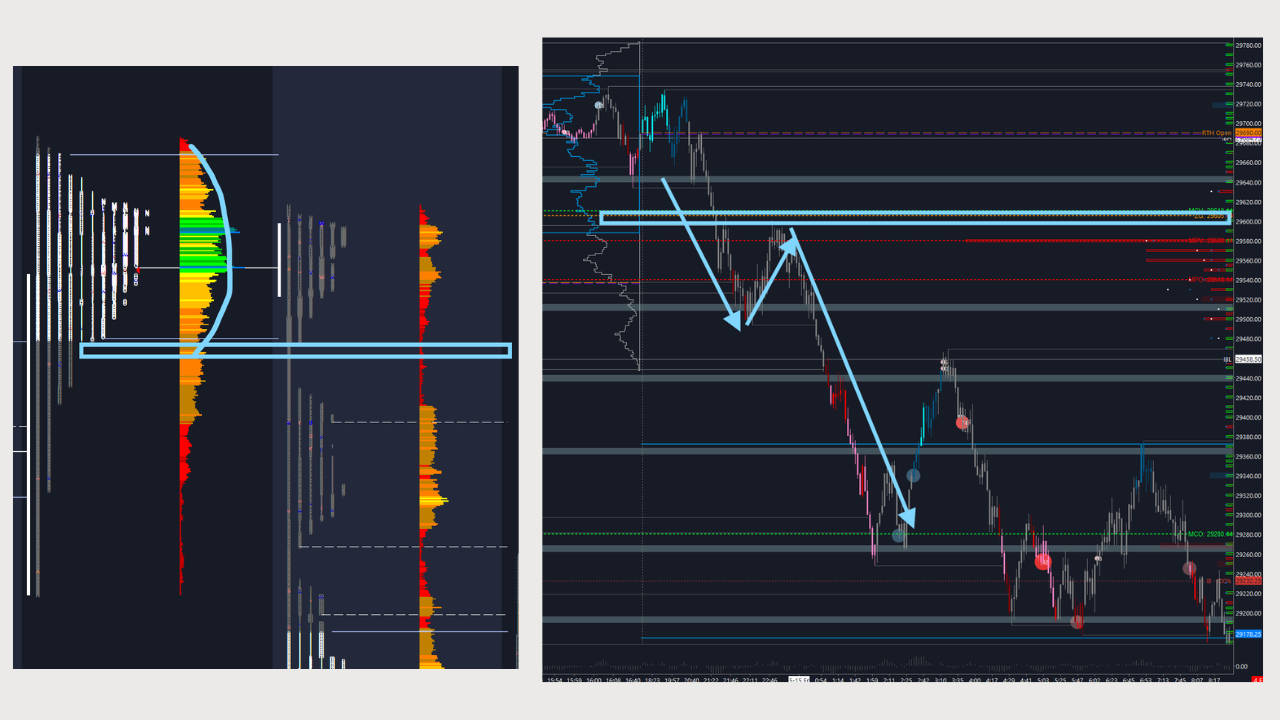
The extended trading hours session (overnight) is used to gather information for the following regular trading hours session. Key reference points: the balance low (where the low volume tail begins) and the top of the overnight balance. When prices expand above the overnight high into the regular session, a trend move is expected. If prices move back below that level, the bias flips to selling rallies to get price back within balance.
For example: the top of the extended trading hours balance is 29,610. When prices expand outside, to the upside during the following session, we expect a trend move to take place.
Just like the trend move is expected higher, if prices were to move back within the balance under 29,610, traders expect to sell rallies to get price back within balance and migrate to value.
Session profiles: the overnight balance top at 29,610 defines the line — above it, trend continuation; back inside, sell rallies to value
Profile Shape: Reading Market Intent
Beyond the individual components, the overall shape of the volume profile carries its own message. The shape tells you what type of activity drove the session — and what to expect next.
High volume at the top, thin distribution below. Signals short covering or a buying climax. Buyers are trapped at the highs. If developing at the top of a run, this is a bearish distribution structure — price has moved up without building balanced value below it.
High volume at the bottom, thin distribution above. Signals a selling climax or long liquidation. Can indicate accumulation at lows. If developing at the bottom of a decline, this is a bullish structure — the market is building a base with strong participation at the low end.
Volume distributed symmetrically around the POC, with the value area filling a healthy range. This is the textbook balanced market — fair value established, both sides participated equally. Price is likely to stay within range until a catalyst breaks it out in either direction.
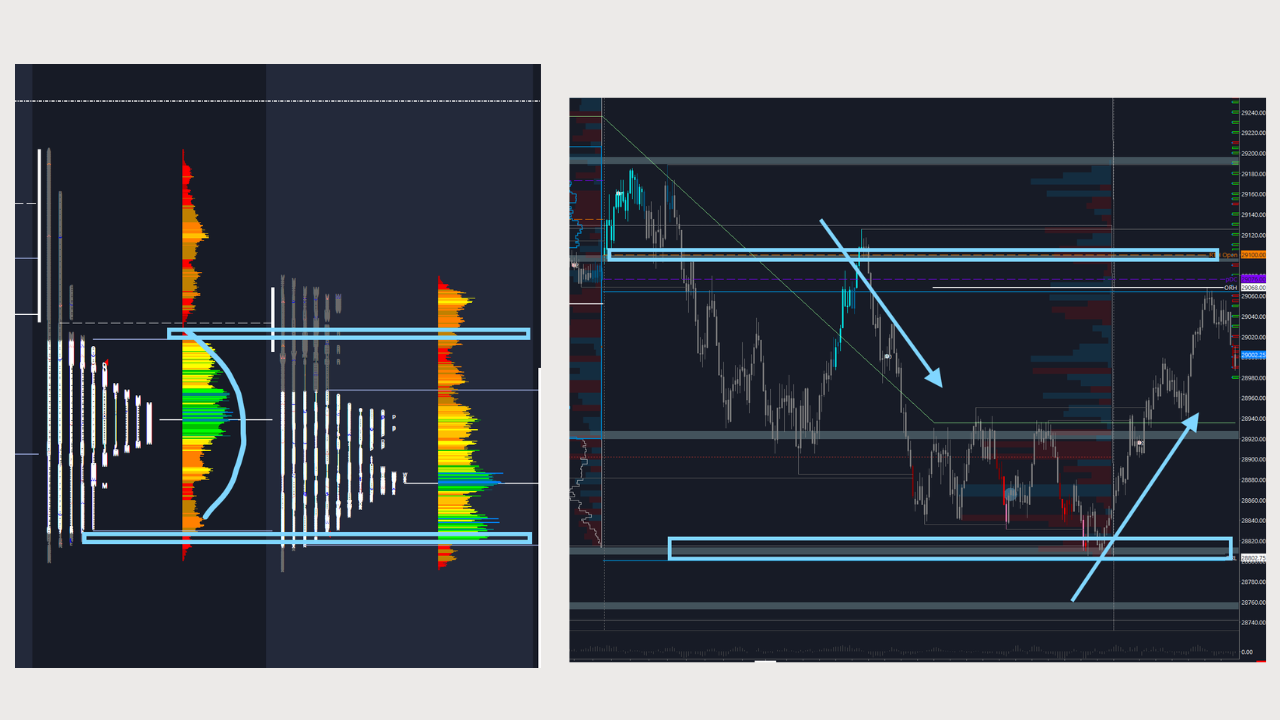
Two distinct HVNs separated by an LVN. The market auctioned at one level, rejected, moved to a new level, and re-established value there. The LVN between the two distributions is a critical battleground — which distribution price returns to tells you which side controls the auction.
Developing a Strategy Around AMT: The EDGE Trading System
The EDGE Trading System revolves around developing a market hypothesis through AMT and executing based on Order Flow.
The success of the system is reliant on traders being patient enough to let the market play out and give them their trade based on the setup.
AMT is the foundation, this is where all of the heavy lifting is done. Understand this thoroughly and you're already going to be ahead of 90% of traders. The next step is turning into a repeatable daily process that generates consistent trade ideas, defined context, defined risk management & execution.
The EDGE Trading System is a four-step framework:
- Evaluate: Identify the current market context using the composite and session volume profiles based on AMT principles. Are we in balance? Out of balance? How did the price get to where it's at?
- Define: Zero in on the areas that you want to trade based on volume profile extremes. Define the trades, the bias and the direction. This is when we develop a trade plan and the "next best trade". These are the only trades we should be taking on a day to day basis.
- Gauge: When we develop a hypothesis based on the first two steps, we need confirmation. This is where order flow comes into play. We'll look at a different structure of tools, delta, footprints, depth of market to gauge if the trade is actually confirmed or not before jumping in.
- Exit: Risk management is numero uno, understand the risk of the trade, the potential of the trade & then we can manage the trade. The risk can be defined with AMT & order flow as well as how far we can go. In the EDGE Trading System, we don't take negative R trades.
The two fundamental questions that drive each trade plan are: Where does the market want to go? How well is it doing its job?
These questions, rooted directly in AMT, remove subjectivity and replace it with objectivity. The hypothesis-driven trading strategy.
Let's dive into an example on how we can Evaluate & Define the market context & trade hypotheses using AMT to develop a concrete trade plan & trade setups for the day.
Evaluate:
Using the composite profiles, 200-day and weekly, we want to identify where the major balances are and where price is at before the market opens.
We'll use the S&P500 E-Mini (ES) futures for the example.
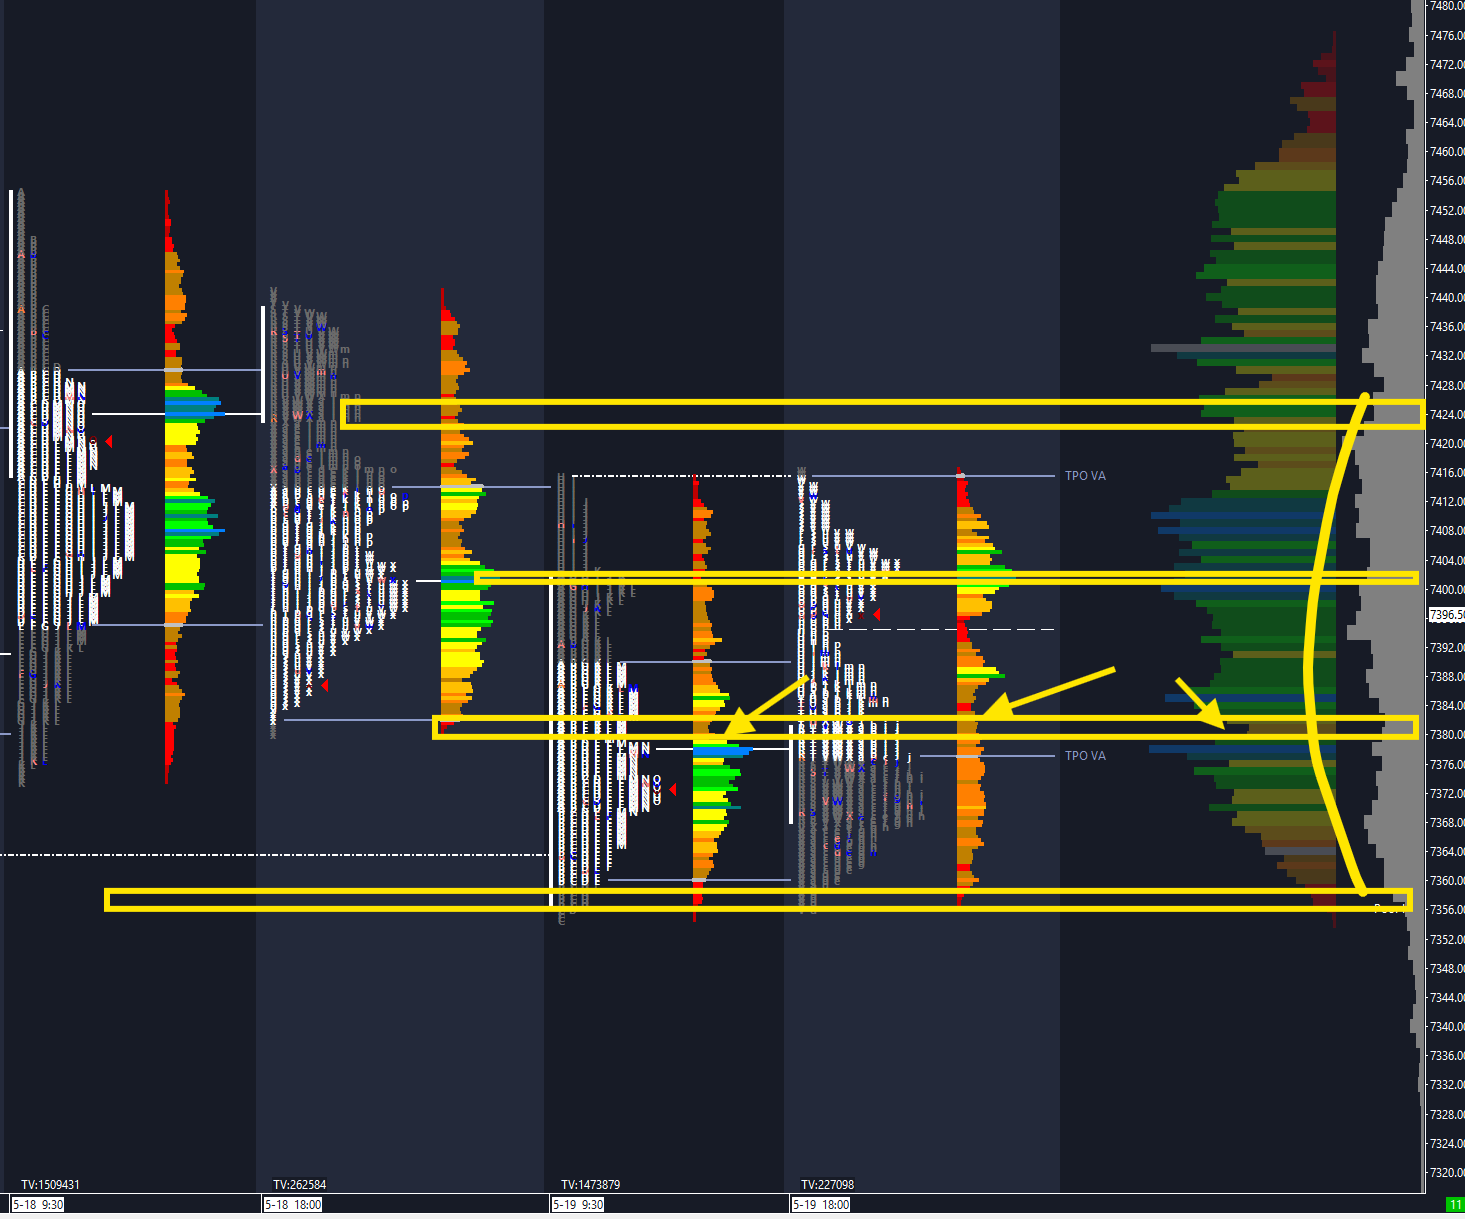
The market balance is between 7360 and 7460. There are areas in between that we want to trade that create smaller balances.
We're above the first minor level that creates the balance at 7380 after moving up from 7360. Meaning context is currently slightly bullish.
Expectations are that we want to see prices move through balances higher towards the 7425.
Define:
The trades that we want to take are going to be based on the extremes that we have that develop the trade levels.
7360, 7380, 7400, 7425. Those are all the immediate levels. The 7380 comes from the prior day balance top, and the current overnight LVN. There is also heavier volume at the 7400 which could cause problems.
The current trades are:
- Long 7380
- Sell 7400
- Possible sell at 7425 on a failure
As we see in the image below, all of the trade ideas develop with good profit potential.
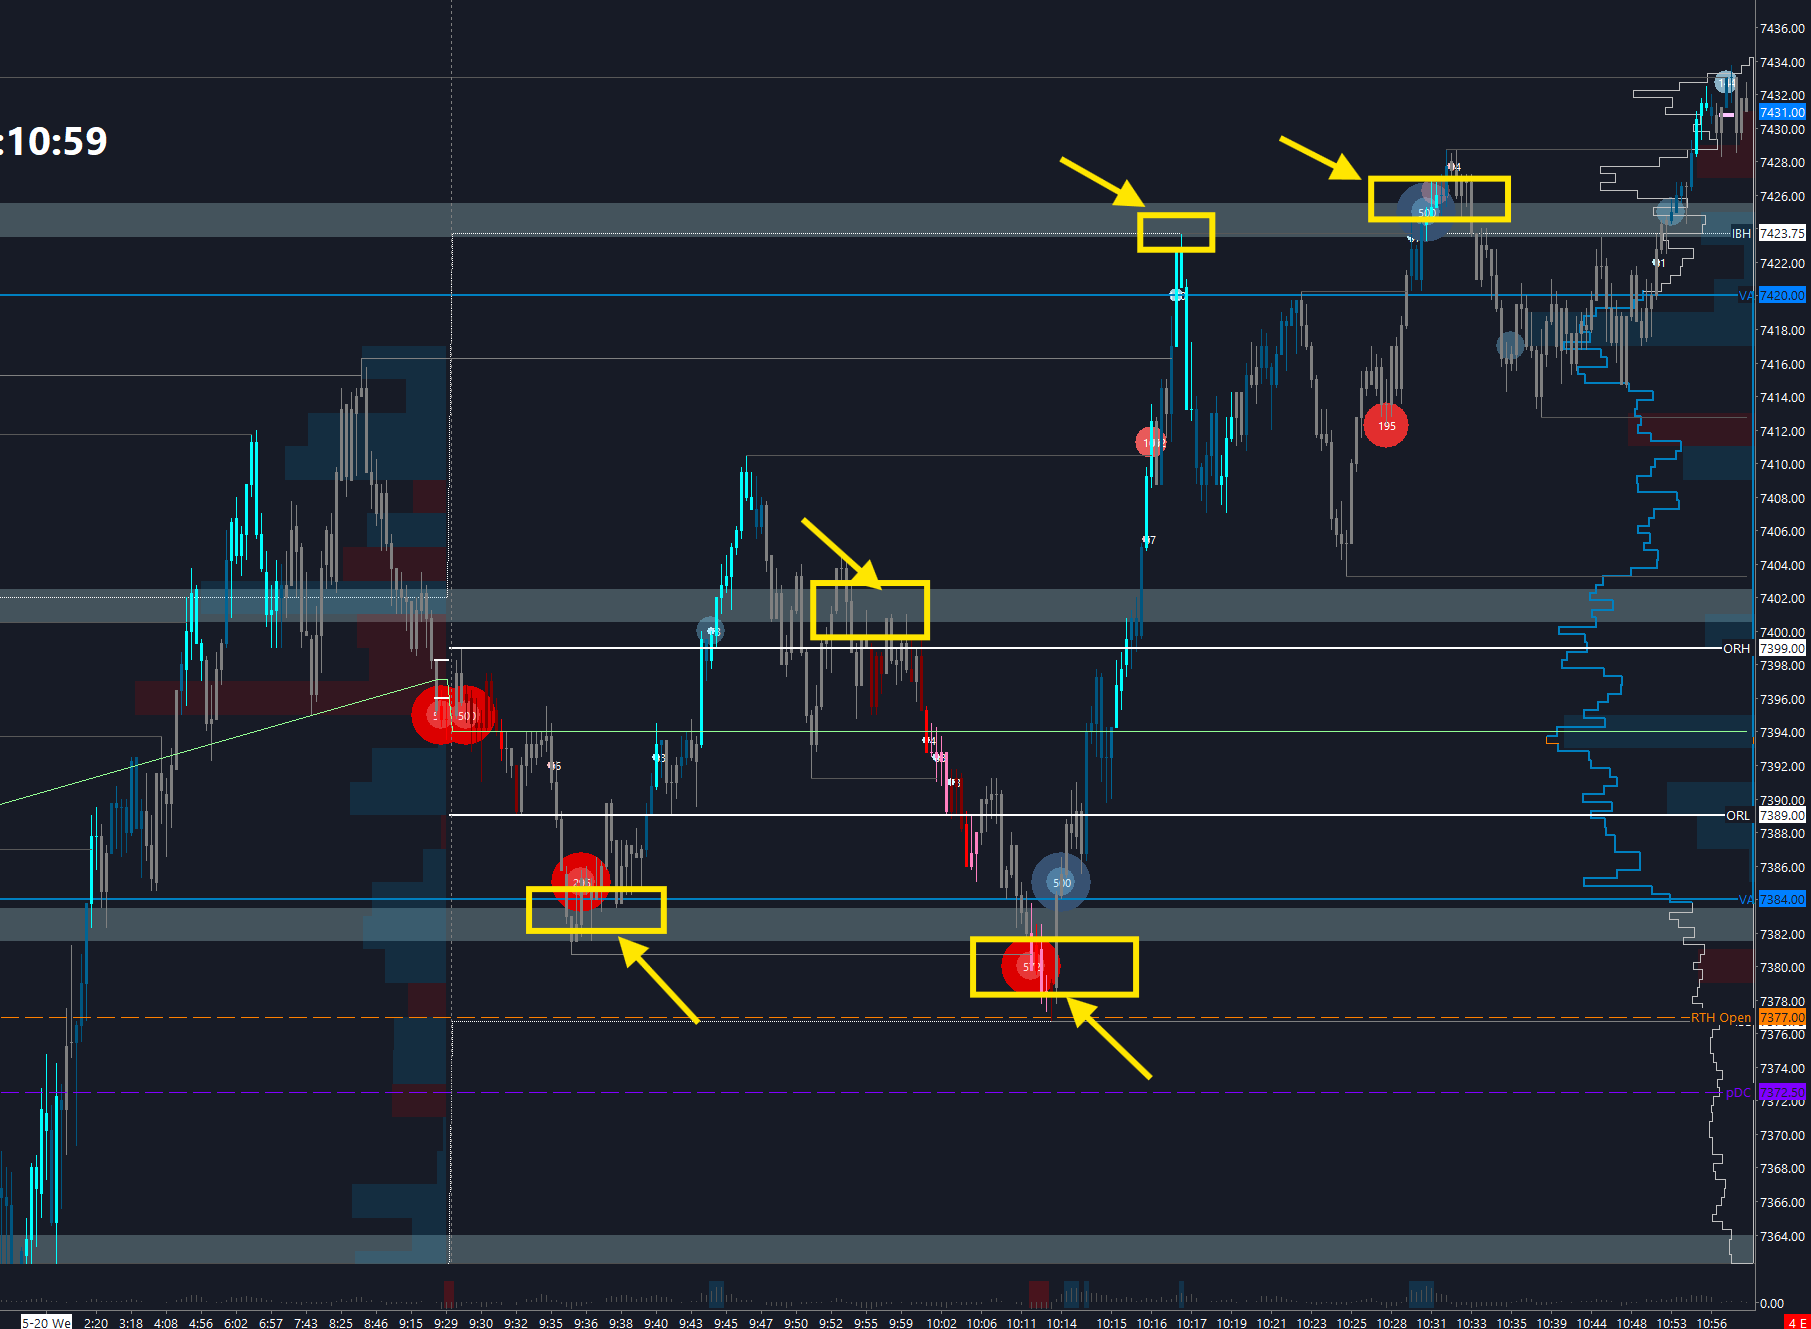
The next steps are based on Gauge & Exit. Driving the confirmation if we want to take those trades or not.
Rather than guessing where price is going, you create a hypothesis around market movement. Prices want to move from balance to balance. Understanding that principle tells you where to look, which direction to lean, and how to manage the trade as it unfolds. This is the professional approach to futures trading — and it starts with Auction Market Theory.
The full AMT curriculum — from these foundational principles through live volume profile analysis, profile shape reading, and daily EDGE Trade Plan development — is covered in full inside Paralia Trading Desk's course library and daily live streams.