The EDGE Trading System is a four-step futures trading framework developed at Paralia Trading Desk. Built on Auction Market Theory (AMT) and confirmed with Order Flow, it gives futures traders a structured, repeatable process for reading market context, building a trade plan, confirming entries, and managing risk — every single session.
What Is a Trading Edge — and Why Most Futures Traders Don't Have One
Most traders search for the perfect setup, the right indicator combination, or the best time frame. What they're actually searching for — without knowing it — is an edge. But an edge isn't a single setup. It's a repeatable process that gives you a statistical advantage over a large sample of trades.
Without a defined process, you're not trading an edge. You're trading vibes. And vibes don't survive pressure, drawdowns, or the psychological grind of live futures markets. The EDGE Trading System exists to give you the structure that removes guesswork and replaces it with a clear, hypothesis-driven method.
"A trading edge is not a holy grail setup — it's a process with positive expectancy applied consistently over time."
The Four Steps of the EDGE System
EDGE is an acronym that maps every trade from the broadest context down to precise execution. Each step builds on the last, creating a framework where nothing is left to impulse or emotion.
Evaluate — Read the Market Context
Before placing a trade, and diving head first into the markets, we need to understand the market context. Using Auction Market Theory we evaluate where the market is most likely heading by answering these two simple questions:
- Where are we in relation to balances?
- How did we get there?
If the market is in balance (ranging) or imbalance (expanding/trending) we want to be on the right side of the trend.
Analyzing the volume profile to identify where the major balances are, where the daily balances are and where the extremes of those balances are. That is where we want to trade. Where does volume drop off into a low volume node?
If there was an expansion overnight into a new balance, or a failure to expand into a new balance, we identify direction through those moves. This step sets the foundation for every decision that follows.
Define — Establish Your Trade Plan, Hypotheses & Bias
Once we understand context, we define where we want to trade. We create a trade plan that is based on hypothetical trade setups and directional bias. We think of this as the "next best trades". This allows us to have a set of 2–3 defined trades based on key decision points.
Where does the long or short continue? Where does it fail? We use the volume profile for this step to dive into large composite extremes and individual profile areas that might provide more insight. We can add other tools like delta and GEX to help solidify the trade idea further.
A defined bias removes the indecision that causes most traders to freeze or flip-flop mid trade. A malleable defined bias, because we don't want to be rigid as the market moves.
Gauge — Confirm With Order Flow
Context and bias alone can get you far, but we can do better — to get more precise and to truly confirm that the hypothesis has a higher probability of success. We want to look at order flow. This is where Order Flow tools like the Footprint, Delta and even GEX come into play. At your defined level, watch for absorption (aggressive selling met with passive buying, or vice versa), massive repositioning in flow, imbalance traders coming in, major call or put walls stepping in. These signals tell you that large players are active at that level, giving you the timing and conviction needed to enter.
Exit — Risk Management, Targets & Closing
The final step is often neglected. You're a risk manager first — you need to have your defined risk, and the expectancy of the trade. What is the potential of the trade? If it proves to be negative R then you want to avoid it. We want to use AMT and order flow to identify the next area this trade might struggle at. Based on the risk we want to take on the trade, does it make sense to trade at all? Set your risk clearly, don't overmanage the trade and play it to plan, not emotion. Money is made on the exit.
The EDGE Trading System Full Breakdown & Steps
Evaluate:
Market context is the guide and road map to the markets, it's a big picture view that a lot of traders miss out on because they're too focused on the smaller moves in price.
Once we understand context, we understand where the market most likely is headed and how good of a job it's doing at continuing the move.
There are two main tools we want to deploy for market context and the read, and they're both composite profiles.
- The larger view: 200 or 300-day composite profile
- The immediate view: the weekly composite profile
The goal:
- Establish where the major balances are (on the 200/300 day profile these rarely change)
- Establish confluence with the weekly profile
- Establish where price is in relation to the balance
- Establish the current direction continuation & failure
As we can see in the image below, we have a major balance on the Nasdaq E-mini (NQ) futures between 28,920 and 29,120. With heavy volume on either extreme.
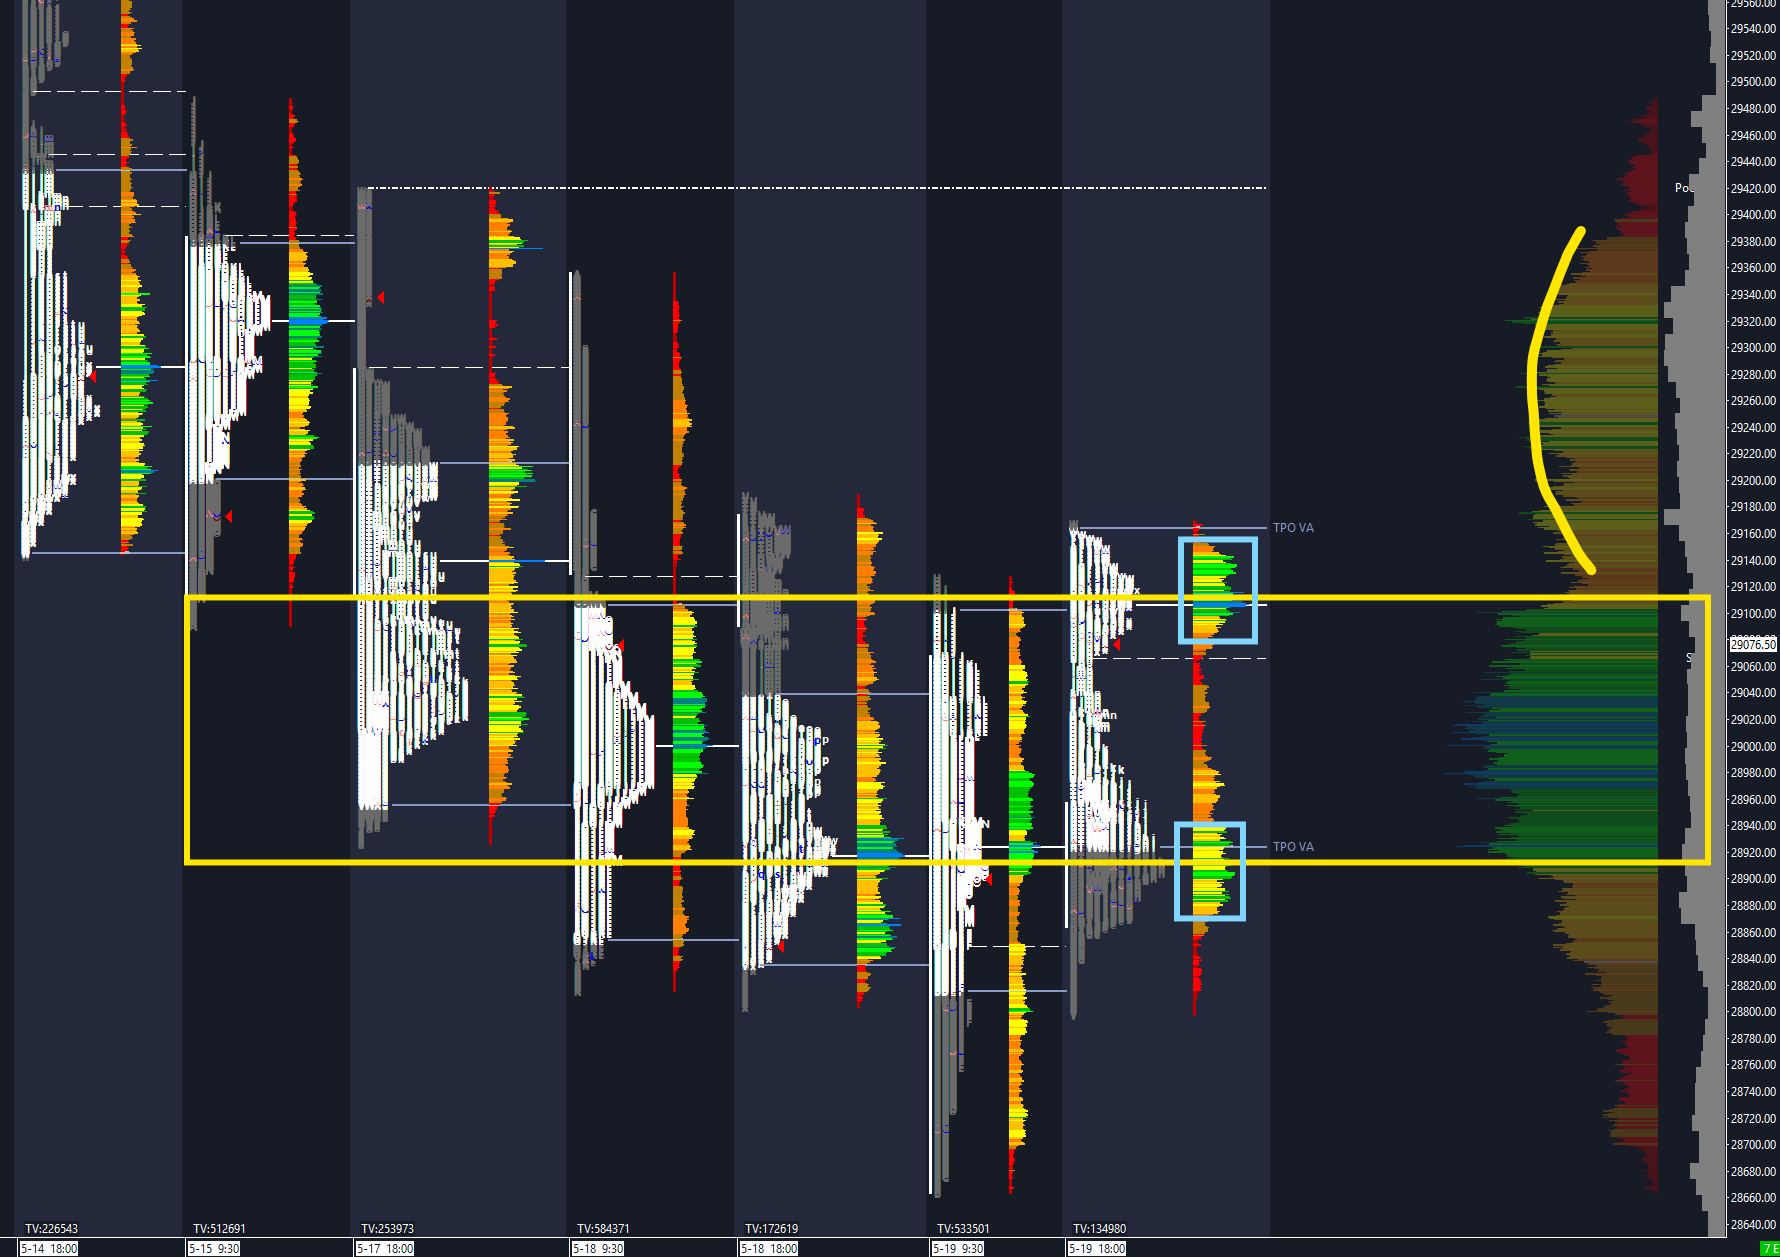
Since price is back under the balance top, there is slight bearish pressure to hold into some of the low volume nodes. If we move above, contextually we look for a bullish move and rally.
Define:
Identify what the trade plan is, based on the volume profile and AMT. What are the trades that we're looking for?
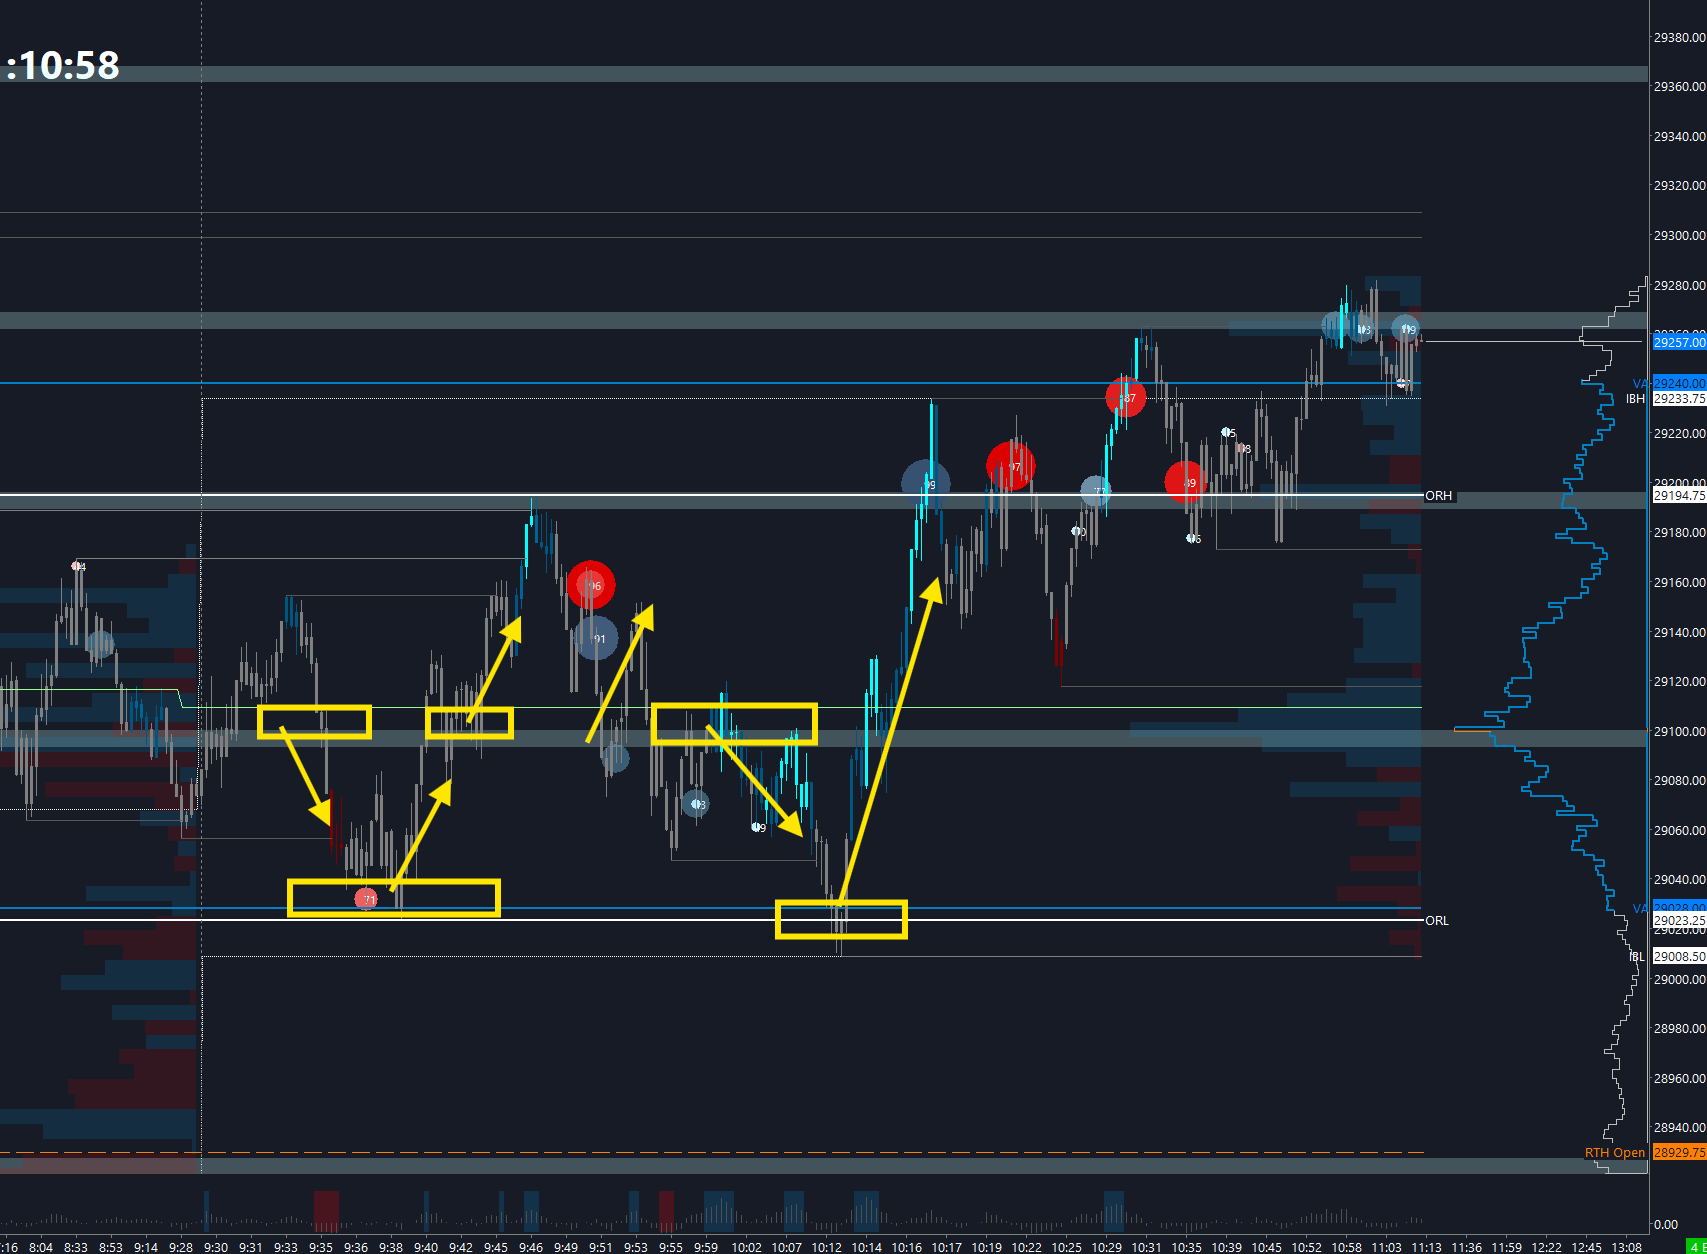
This is where we develop a bias and hypothesis. Under 29,120 there is pressure for the sell side, however there are low volume nodes at 29,040 and 29,010 where we could look for some long continuation.
The trades?
- Sell failures above 29,120
- Buy 29,040
- Buy 29,010
- Buy above 29,120
As we can see in the image below we have the setups, some of them are more clean than others. Like buying 29,040 and 29,010 also some of the failures below 29,120 but not as clear cut.
How can we improve on that? Let's Gauge the confirmation.
Gauge:
Using Order Flow to confirm the move is valid or not comes in several different tools. Such as Delta, Large Trades & the footprint.
The cleanest way to look at order flow to help gauge if the trade is valid or not is to identify the outliers in order flow. Meaning, where are there massive traders that are trapped or active?
For that we can start with a mix of large trades & the footprint.
Large trades on the footprint appear as bubbles to really highlight those big players.
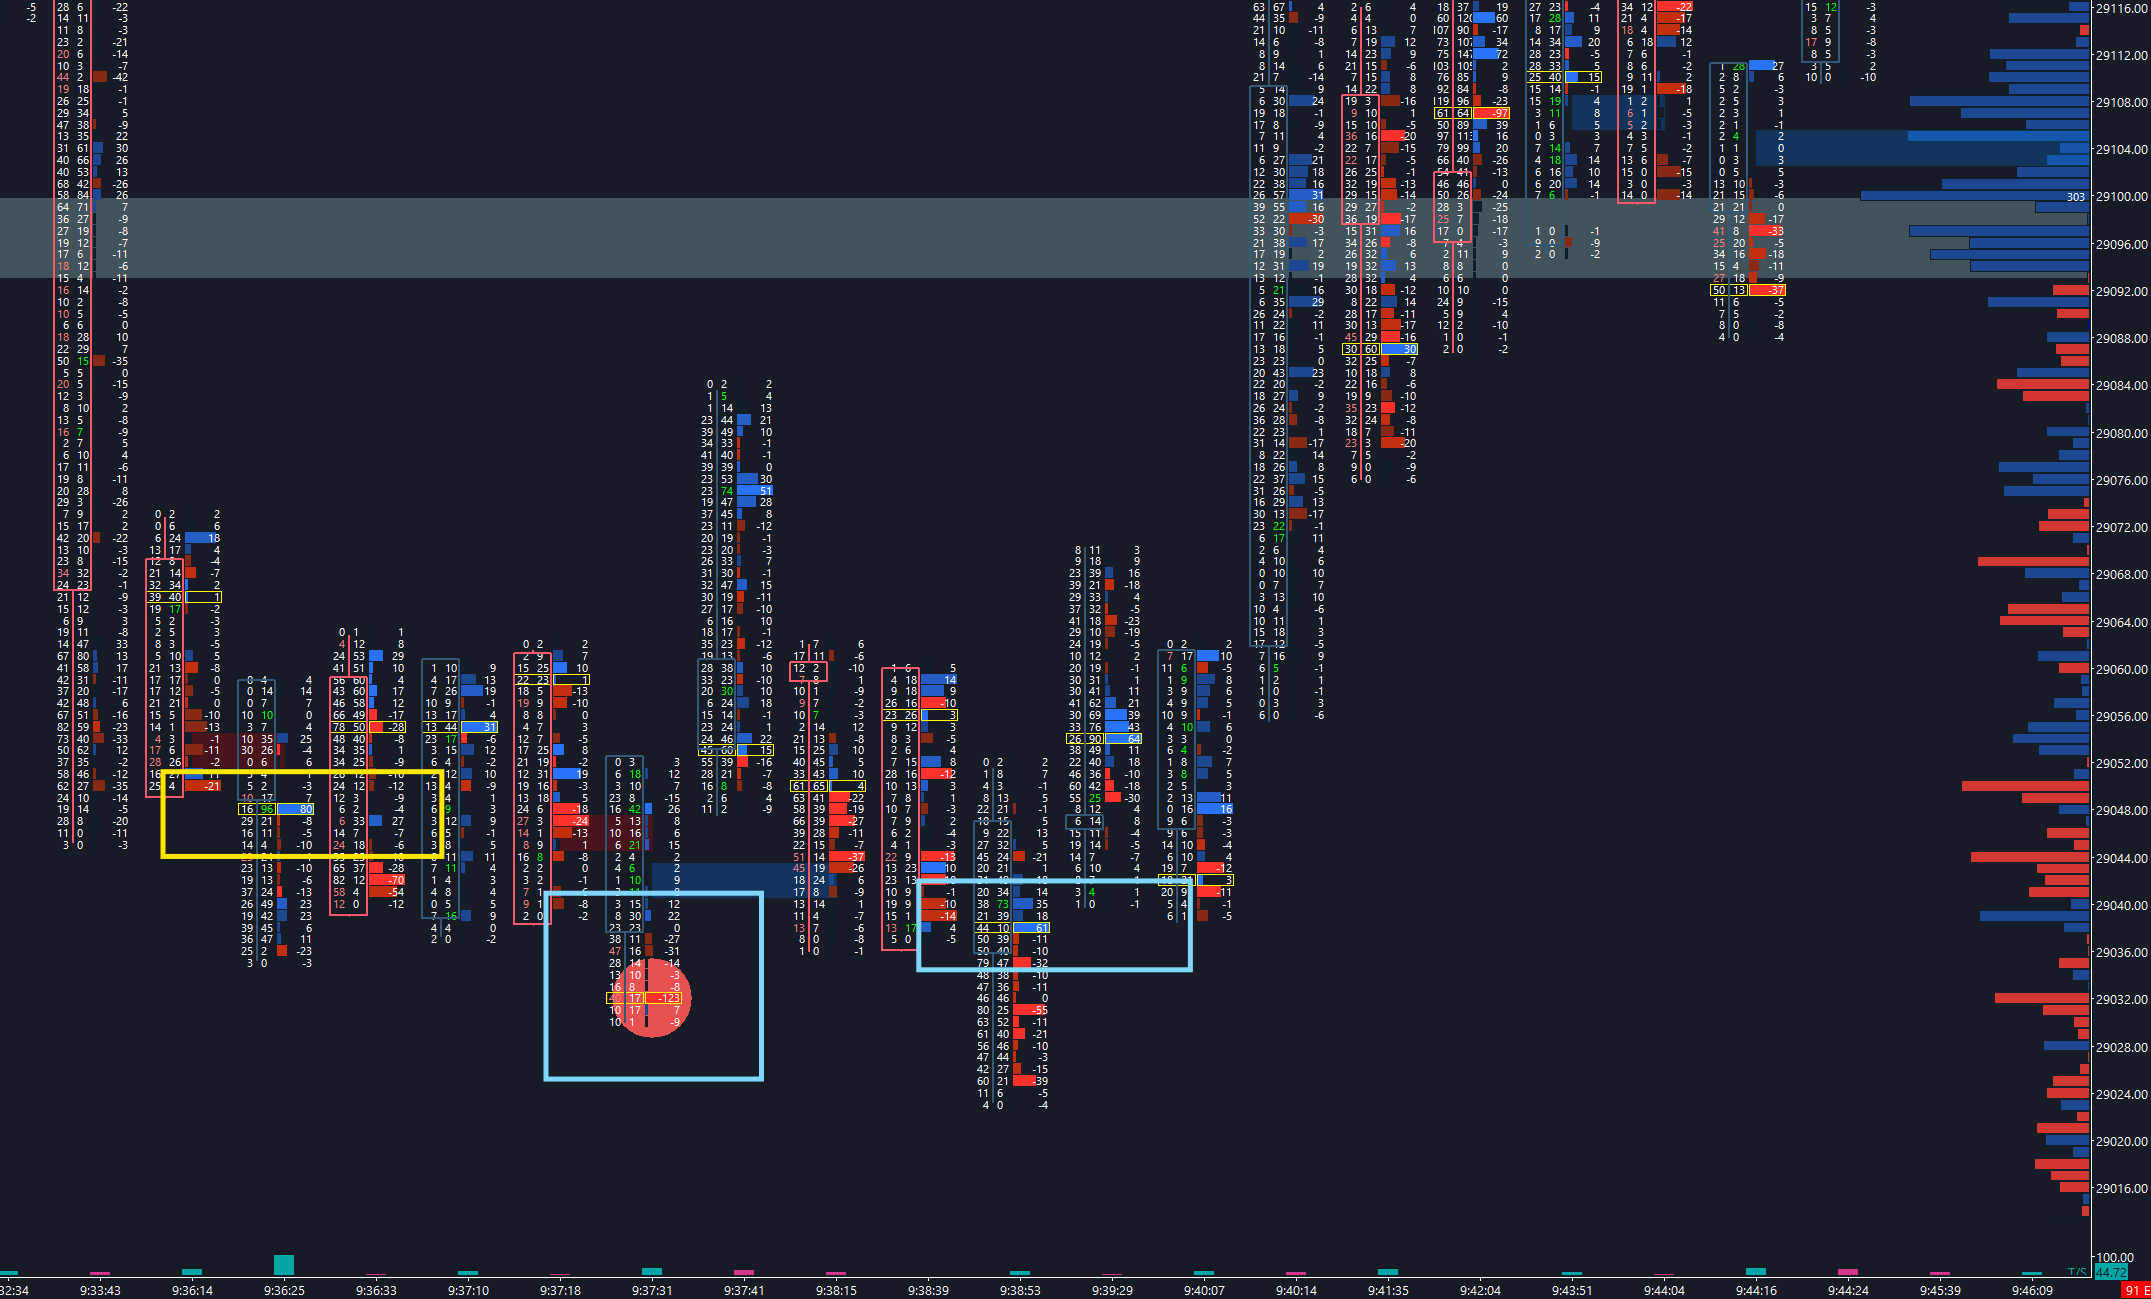
If we're trying to qualify the long from 29,040.
We can look at the footprint below:
There are some initial buyers that stick out on the rotations, however when the large seller in the red bubble comes in and price shoots up from the area, the rotations and new buyers that step in help confirm this region wants to hold so we can pull the trigger for the long and take a position for a move higher.
Exit:
The final piece of this trade, something we need to think about even before entering: what is the risk? What is the potential?
The risk on NQ trades is between 15–20 points. Based on where the sellers were absorbed and the pop in price the entry would make the most sense around 29,035–040. The low of the move is 29,025, meaning that we're within our risk parameters (barely). The potential of the move is initially the 29,100–115 area where we have our major balance top from the Evaluate/Define stage. Which means that on 20-points of risk, we're looking at 60–70-points of return, which is at least 3:1 RR. This trade makes sense, we pull the trigger and wait to see if the move plays out without wanting to overmanage the position.
Why a Framework Beats Individual Setups
Individual setups work — until they don't. Markets change, volatility shifts, and a setup that worked perfectly for six months can stop working overnight. A framework, on the other hand, adapts. The EDGE system teaches you to read what the market is doing right now, not to apply a fixed pattern to an ever-changing environment.
When you trade a framework, losing trades become data. You can review each step, identify where the breakdown occurred — was it a misread in the Evaluate step? A premature entry in the Gauge step? — and tighten your process. That feedback loop is what separates traders who improve from traders who stay stuck.
Building Consistency: Process Over Outcome
The hardest mental shift for most traders is detaching from outcome and focusing on process. A well-executed trade that loses is still a good trade. A poorly-executed trade that wins is still a bad trade — it just doesn't feel like it in the moment.
To build consistency with the EDGE system:
- Journal every trade with notes on each of the four steps
- Review your process, not just your P&L
- Paper-trade new interpretations before applying them live
- Hold yourself to your defined risk parameters without exception
Over time, a consistent process creates a consistent result. That's the edge.
How to Get Started With the EDGE Trading System
The EDGE Trading System is taught in full inside Paralia Trading Desk — from the foundational Auction Market Theory and GEX concepts through live daily application on NQ and ES futures. Members get access to the full course library, daily live streams where the EDGE framework is applied in real markets, and a community of serious traders working the same process.
If you want to start immediately, begin with Auction Market Theory. Understanding why price moves — balance, imbalance, and value area structure — is the prerequisite for every step in the EDGE Trading System.
For order flow confirmation, the Introduction to Order Flow: Footprint Charts guide covers delta, footprints, and large trade identification — the exact tools used in the Gauge step.