What Is GEX?
Gamma Exposure (GEX) measures the total gamma risk held by options market makers across all outstanding contracts on a given underlying. To understand it, you need the basics. Delta measures how much an option's price moves relative to a $1 move in the underlying. Gamma measures how fast that delta changes as price moves.
Market makers who sell options are constantly delta-hedging their books. As the underlying moves, their delta shifts and they must continuously buy or sell the underlying to stay neutral. GEX quantifies that aggregate hedging activity and answers one question: at current price levels, how are market makers forced to behave?
"The options market doesn't just reflect expectations — it creates gravitational forces on futures prices that are measurable and tradeable."
GEX is forward-looking — it reveals where price has a high probability of mean-reverting or trending, and why price can reverse sharply with no obvious fundamental catalyst. It is a mechanical, structurally-driven form of support and resistance based not on price patterns, but on what large institutional participants are obligated to do.
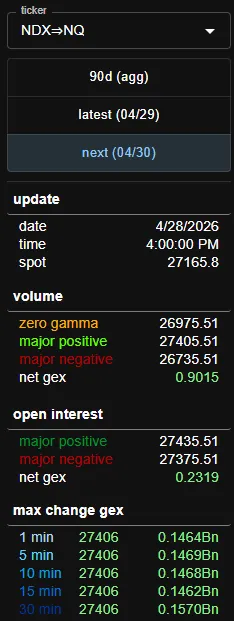
Below is a screenshot from Gexbot, where I get my GEX information. The histogram (green and red) in the middle are the GEX levels. I'll break down more info on Gexbot and the tools that help with GEX in the sections below.
How Gamma Works
Options have a value called Delta — roughly, how much the option's price moves per $1 move in the underlying asset. Gamma is how much Delta changes as price moves. When you buy an option, you are long Gamma. Market makers who sell you options are short Gamma — meaning they need to hedge continuously as price moves.
When Market Makers Are Short Gamma (Negative GEX)
They must sell when price goes down and buy when price goes up — amplifying moves. Markets with negative GEX tend to be more volatile and trend further in a given direction because market maker hedging adds fuel to the move.
When Market Makers Are Long Gamma (Positive GEX)
They do the opposite — buy dips and sell rallies. This acts as a dampener on volatility. Markets with positive GEX tend to be more range-bound, with prices pinned around key options strikes. This is sometimes called "gamma pinning."
Why Do Futures Traders Use GEX?
GEX is an options concept — but the SPX and SPY options markets are large enough that market maker hedging flows directly move futures. When market makers hedge, they use ES and NQ. That makes GEX a direct input into futures price behavior even for traders who never touch an options contract. Futures traders use GEX for three core reasons.
Volatility regime identification. Net GEX tells you the environment before the session opens. Negative net GEX means expansions are exaggerated — aggressive moves in both directions. Positive net GEX means the market wants to compress and range. The same setup that works in one environment gets destroyed in the other.
Key structural price levels. GEX clusters around strikes with large open interest, creating gravitational support and resistance. These aren't arbitrary lines — they are the product of institutional positioning built up over days and weeks.
Flip zones. When price breaks through a major GEX level, the hedging flow reverses. What was support becomes a tailwind for further selling. Knowing where those flip points are lets you anticipate acceleration rather than get caught by it.
Where to Get GEX Data
There are several providers that supply GEX data. I use Gexbot — an external service with integrations for almost any futures trading platform you can think of: Sierra Chart, Ninja, MotiveWave, ATAS, Quantower. Below is what it looks like integrated with Sierra Chart (the right-hand side green/red profile).
The classic view presents a histogram showing gamma exposure strike by strike, split between calls and puts. Bars extending to the right represent bullish gamma exposure — calls. Bars extending to the left represent bearish gamma exposure — puts. The more a bar extends, the more institutional positioning exists at that strike.
The toolbar gives you the key inputs: ticker, DTE (days to expiration), volume toggle, zero gamma line, net GEX reading, and max change GEX across different time frames. Lookback dots track how gamma positioning has shifted over prior sessions, giving you a sense of whether levels are building or fading.
Gexbot is not required to trade, but for traders who want to understand the structural forces shaping their session, it is one of the most efficient tools available.
Open Interest GEX vs Volume GEX
GEX levels can be based on open interest, volume, or both. They use the same foundation but answer different questions.
Open Interest GEX uses total outstanding contracts at each strike — structural positioning built up over days and weeks. It tells you where the market's gravitational levels sit on a sustained basis. Think of it as the map.
Volume GEX uses contracts traded on a given day — what's actively changing hands right now. It shows where fresh positioning is landing and what near-term hedging pressure is being created today. A strike with surging volume GEX but minimal open interest GEX signals something new being built — short-term pressure that may not persist beyond the session. Think of it as the real-time overlay on top of that map.
When you attach Gexbot to your trading platform you can choose to see both or just one in the settings. I generally put more emphasis on GEX volume, but I keep both visible. The main areas I look for are Major Call/Put Volume and Major Call/Put Open Interest. Use both together. Generally, volume GEX is the more actionable intraday input — it reflects what participants are doing today, which is what matters for day trading futures.
Reading the GEX Call & Put Profile
The GEX data is presented in a profile view. On an intraday basis, the 90-day aggregate or 0DTE setting in Gexbot is what you want — it gives you the current positioning rather than stale historical data.
The profile is split into call (green/positive) exposure and put (red/negative) exposure. The call profile sits above the put profile and they can have different lengths. Generally, we view GEX as acceleration of the trend, similar to a balance area on a volume profile. When prices start moving into the positive call GEX region, look for expansion to the upside and hold of support structure. As price moves into the negative GEX area, look for sell-side to take hold.
The split — where calls flow into puts — usually sits around the middle of the profile. This is a major barrier for price and the market will want to hold within the current balance. Not all GEX levels are important. Just like a volume profile, if you're trading everywhere, you won't find anything useful. The largest GEX regions — puts or calls — are the ones to use as support/resistance.
Think of it as a balance. The start of a major balance with large extended levels provides more use than any small level. If prices are under extended call levels, those can be used as immediate resistance (first test) until proven otherwise. Same for extended put levels as support. But the best areas are always going to be the major call and put walls — the largest levels of exposure on the day.
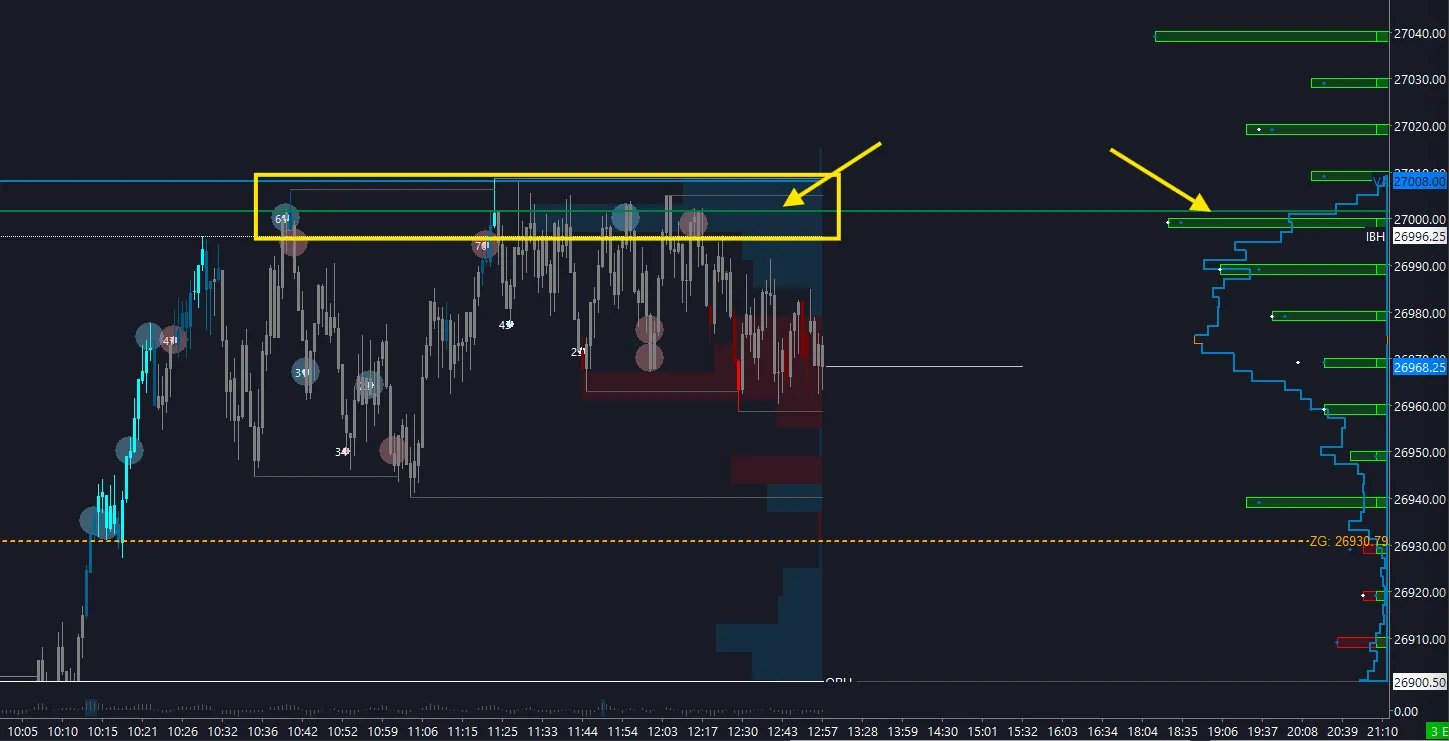
Look at the example below. We're in bullish momentum, with an acceptance of a positive GEX region on NQ above 26,940 — you can see where the gamma flips, suggesting it's better to look long from that level. We have two tests in the region holding the long on a large call wall. However, once price reaches the top where there is a large gamma extension at 27,000–27,010, we start to notice a stall and the development of the top of the balance on the volume profile — the signal to look for the sell side.
Major Call and Put Walls — The Highest Probability Levels
The major call wall is the strike with the largest concentration of call-side gamma exposure — a structural ceiling. When price reaches it, market makers are obligated to sell into strength to maintain delta neutrality. It is mechanically difficult to push through.
The major put wall is the opposite — the largest concentration of put-side gamma exposure. A structural floor where market makers buy into weakness, absorbing sell pressure. As they cover the futures they've been selling to stay delta neutral, buying accelerates and other participants step in.
Don't buy NQ futures directly into a major call wall — you're buying into institutional selling. Instead, wait for price to reach major negative gamma where buyers are mechanically forced in, or wait for price to cross above the start of positive gamma to trade confirmed momentum.
Why Do Reversals Happen Here?
It comes down to 25 and 50 gamma. For 0DTE options, 50 gamma is peak return — regardless of whether price keeps moving. Between 25 and 50 gamma, participants start rolling over and taking profits. Theta makes holding costly. At the major walls, returns have peaked and decay is real. Options participants exit. Market makers unwind hedges. The reversal is not random — it is everyone at that strike doing exactly what their position requires.
At a major put wall, three groups converge simultaneously: options traders taking profits on shorts, market makers buying back futures to stay delta neutral, and futures traders stepping in as price holds. That convergence creates the floor.
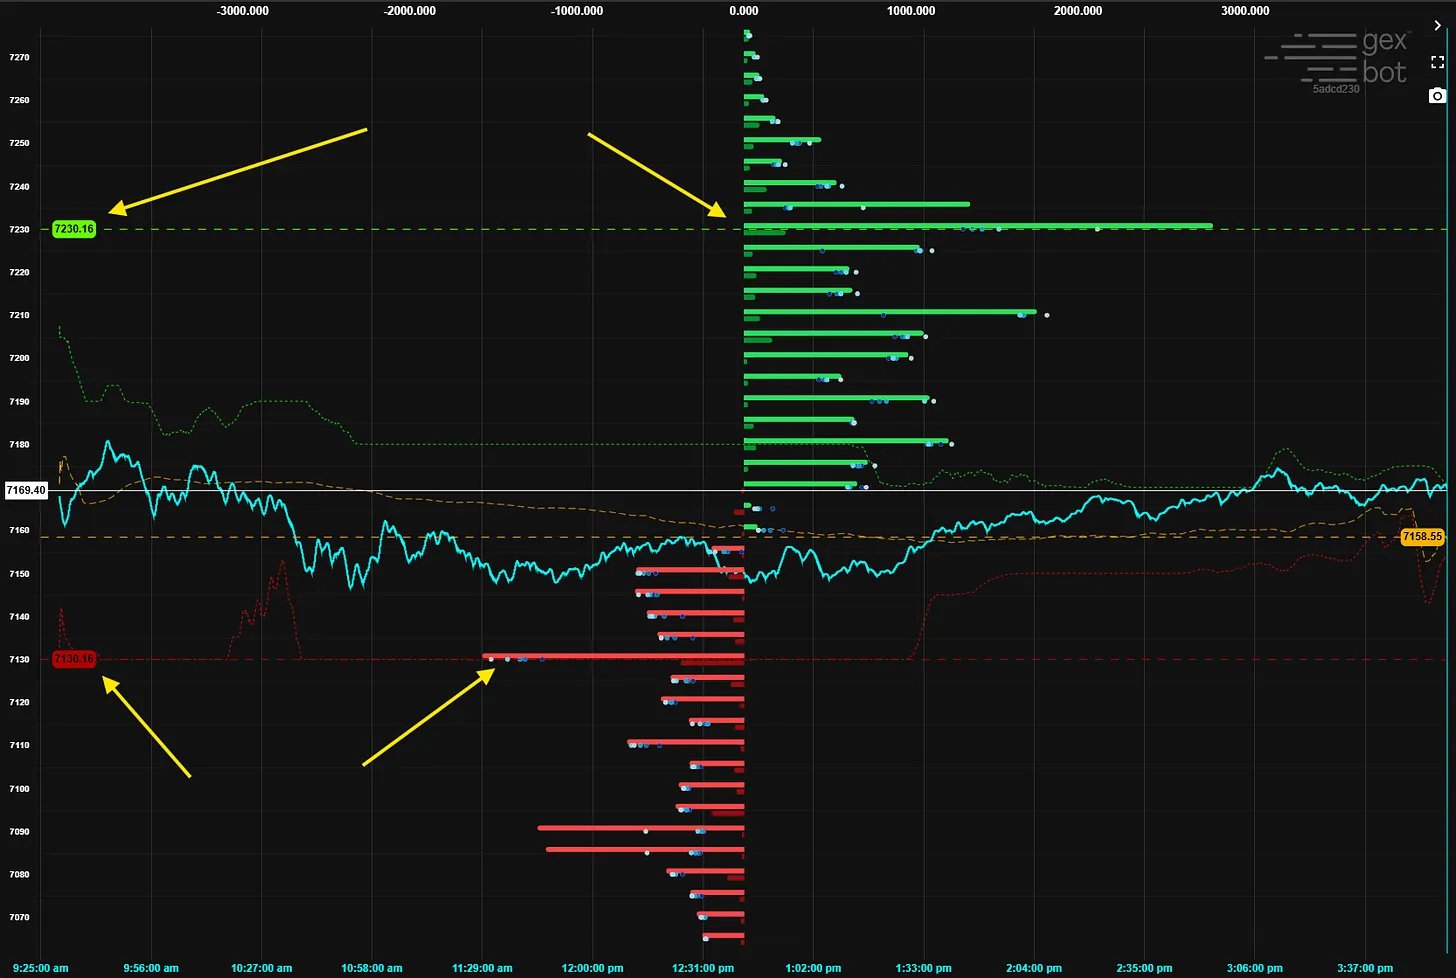
Take a look at the ES Major Gamma areas below — the Call GEX is at 7230 and Put GEX at 7130. These are monster areas where we would look for a reversal on the first test. If we were to use gamma just for these massive GEX areas, we would have ideally 1–2 trades on a daily basis presenting the highest-probability moves.
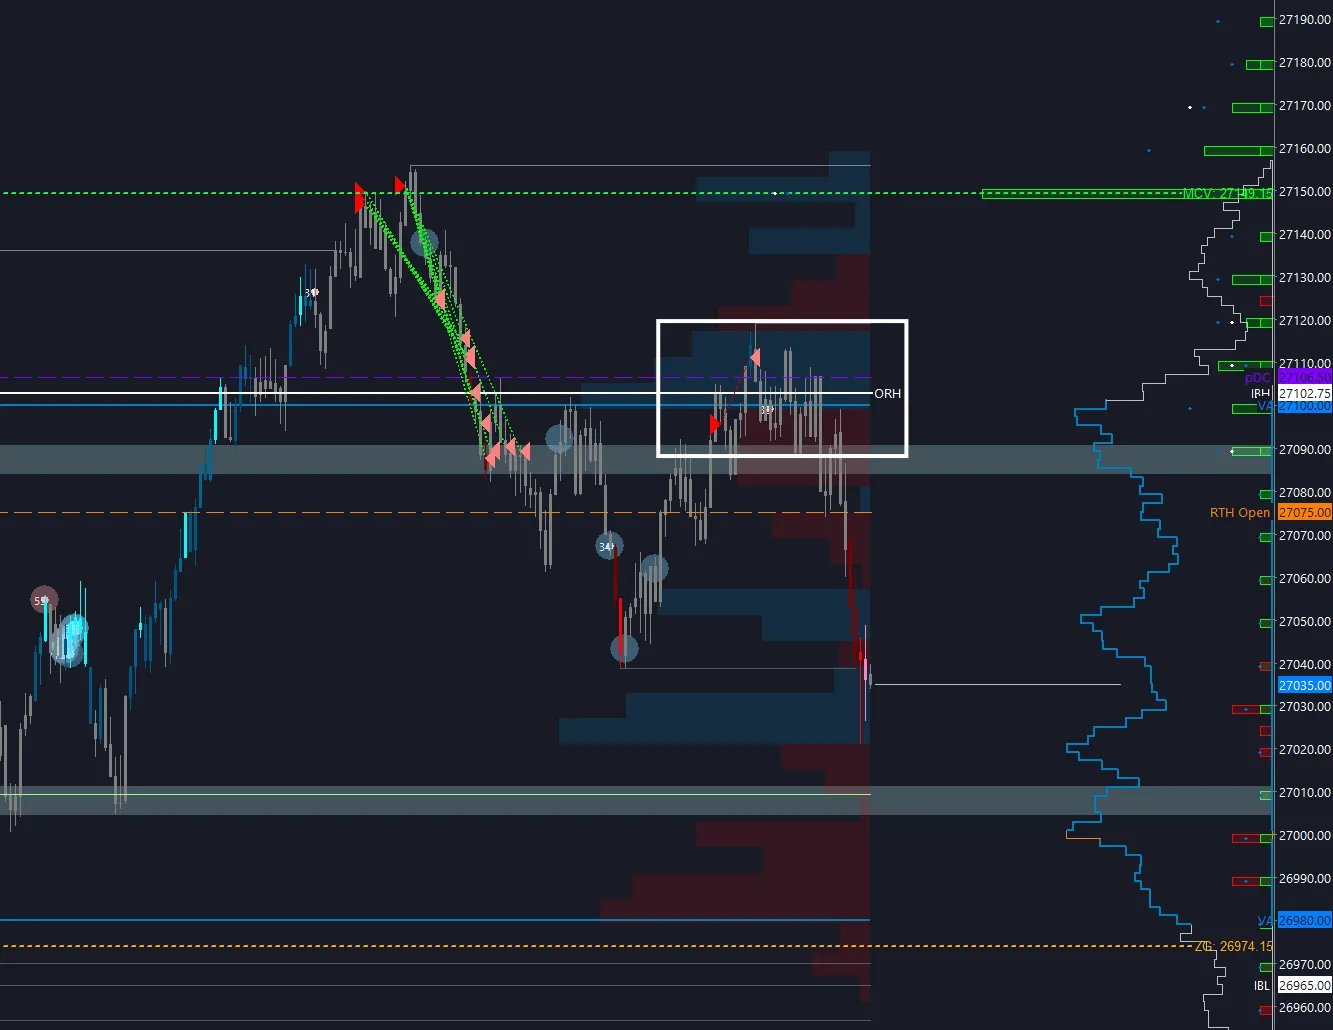
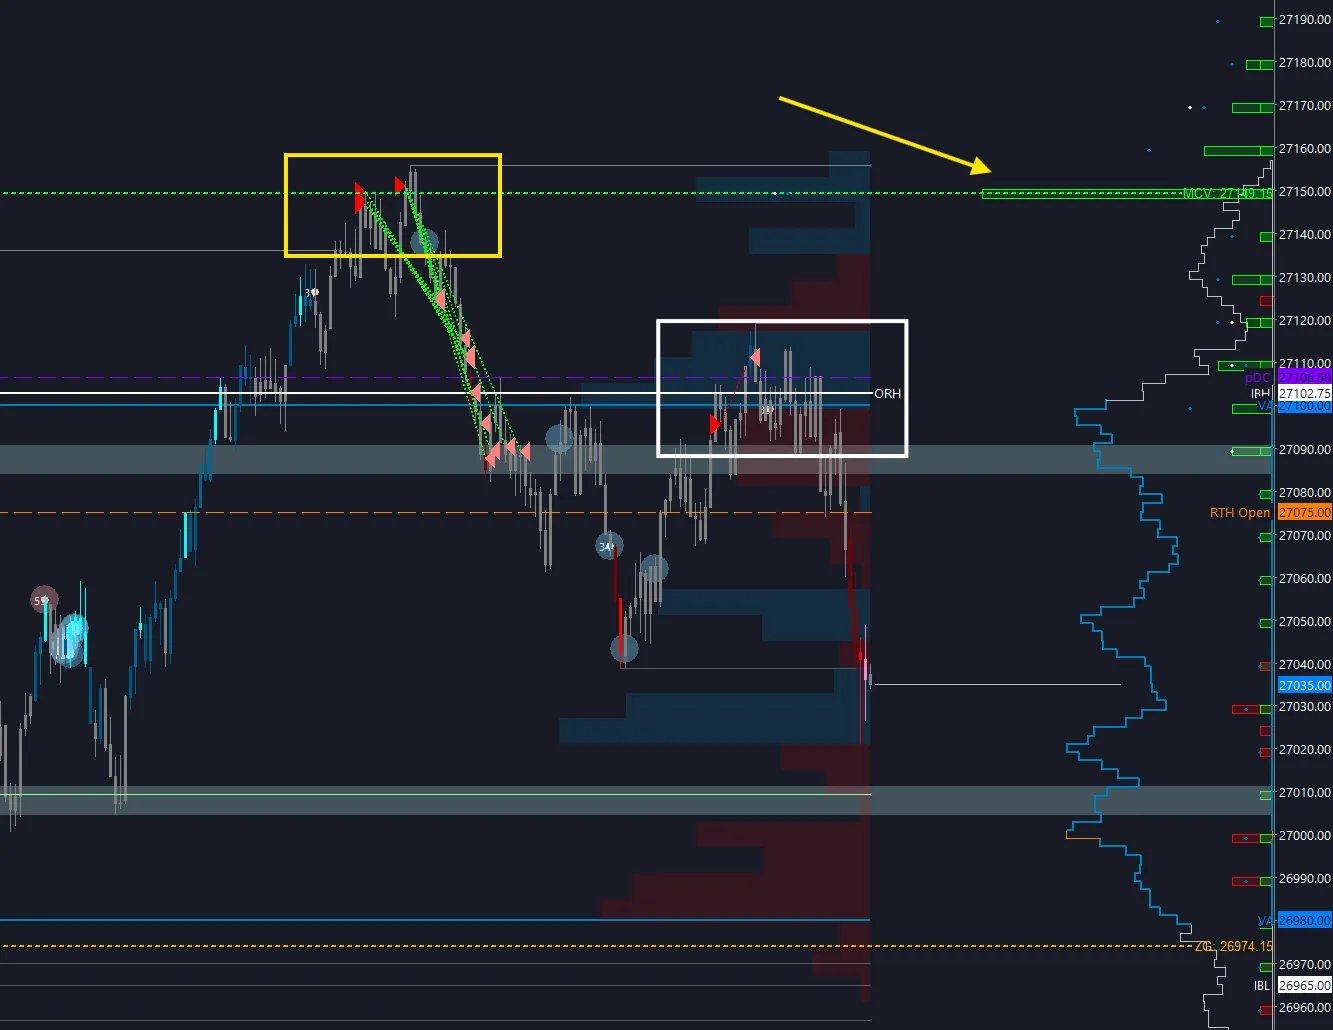
Take a look at the example on NQ — this was in April 2026. Despite a strong bull run, price eventually gets into the 27,150 Major Call GEX area on the first test, which might have even been ATH at that point. Once we run through all of the call GEX and move higher, we reach the major area. This is where MM positioning starts to unwind and we expect repositioning — looking for a fade.
This is the reversal point. The trade goes 5 points in drawdown before we roll over to the first area of interest at 27,090 (60-point move), then ultimately into 27,000 and lower (net 150+ point move).
Zero Gamma — The Battleground
Zero gamma is where call and put gamma exposure are in equilibrium — think of it as a VPOC, the most contested zone on the GEX profile. (Some consider it like the VWAP.) The key rule: avoid trading directly at it. It is a fight zone where neither side has control.
Zero gamma is directional. When price moves decisively away from it, the winner is being revealed. Below zero gamma, sell side takes control and price trends toward the major put wall. Above it, buy side takes control and price trends toward the major call wall.
Zero gamma can shift intraday. When it stays flat and price moves away cleanly, you have a squeeze and trend developing. When it shifts frequently in both directions, conditions are choppy — fades work better than trend following.
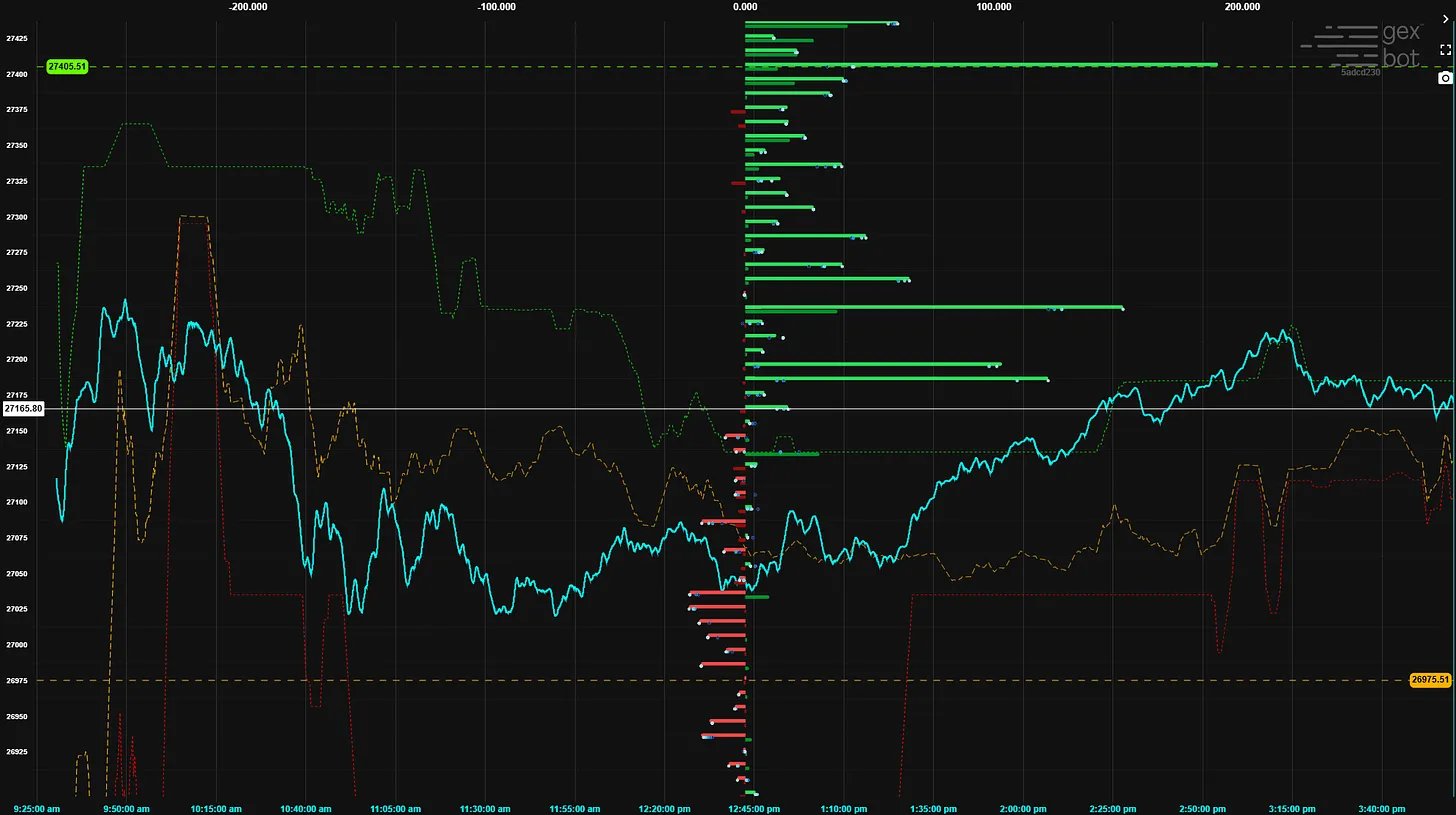
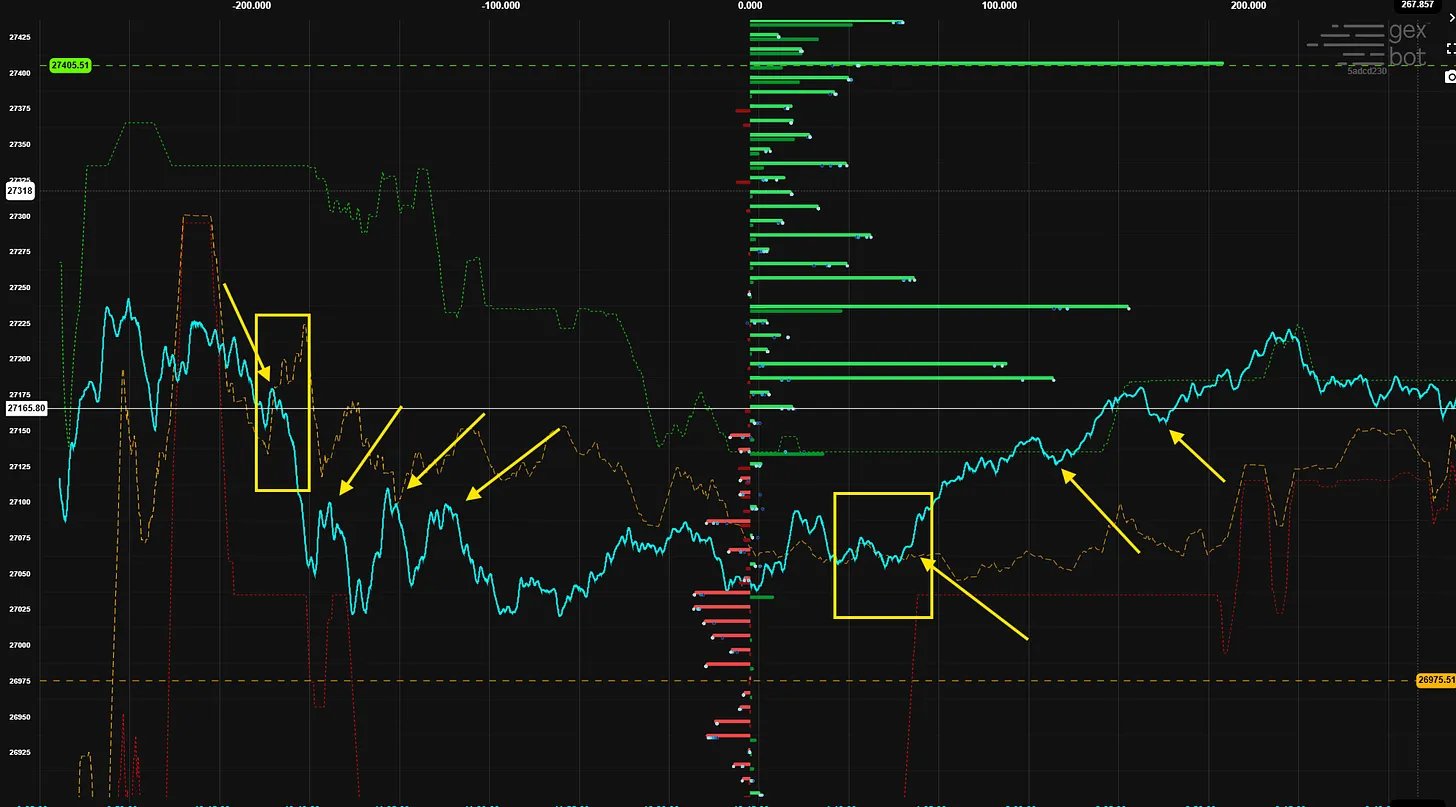
Take a look at the image below. The yellow dotted line is the zero gamma historical movement; the blue/cyan line is the price of NQ throughout the day. When price crosses under the zero gamma region, we start to see a shift in regime where price also starts moving bearish — the idea is to look to sell rallies. Rather than waiting for the zero-gamma area itself to trade, look for other tools in your arsenal — volume profile, order flow — to provide a region to join the trend.
At a point we start to see that price no longer wants to make new lows and begins to base out. Price then moves above the zero-gamma area, we flip the structure again, and start printing a bullish move into the end of the day.
Combining zero gamma with order flow or AMT is the most effective approach. Zero gamma gives you the directional framework. Execution tools give you the entry.
Putting It All Together
I'm not one to jump into a new tool 100% and use it stand-alone — however GEX has helped me stay onside more and add confluence to areas of interest. I tie GEX with AMT (volume profiles) and order flow (confirmation from delta and the footprint).
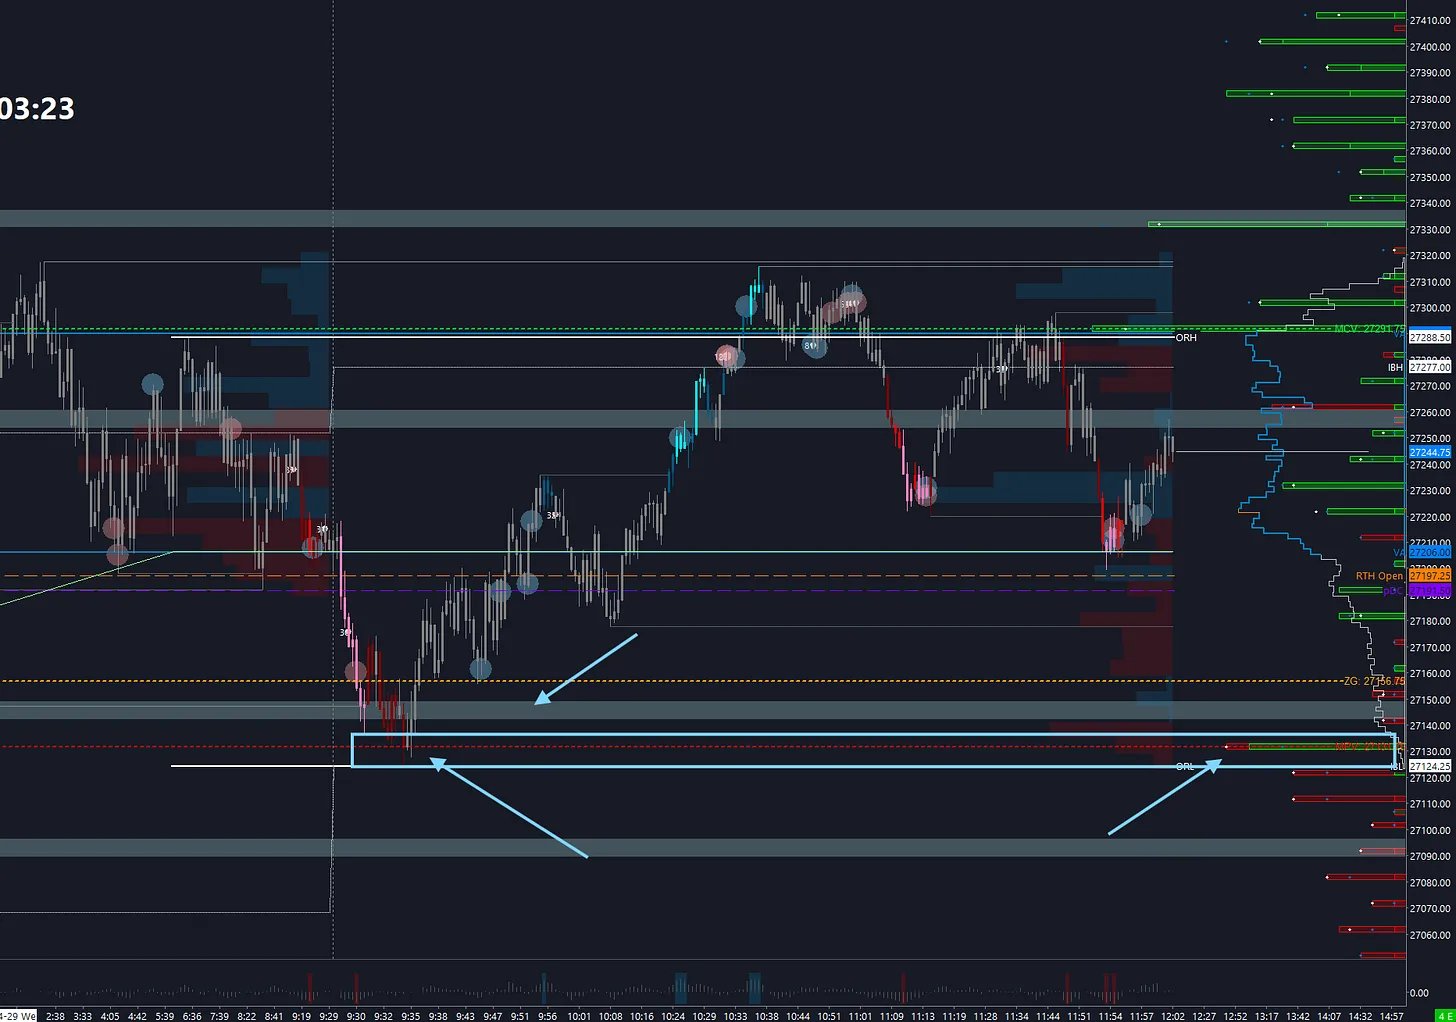
Take this example. Nasdaq Futures. First I look at the general balances and profile to identify that there is a major balance low at the 27,140–150 area, where we would expect the current momentum higher to hold out the bid.
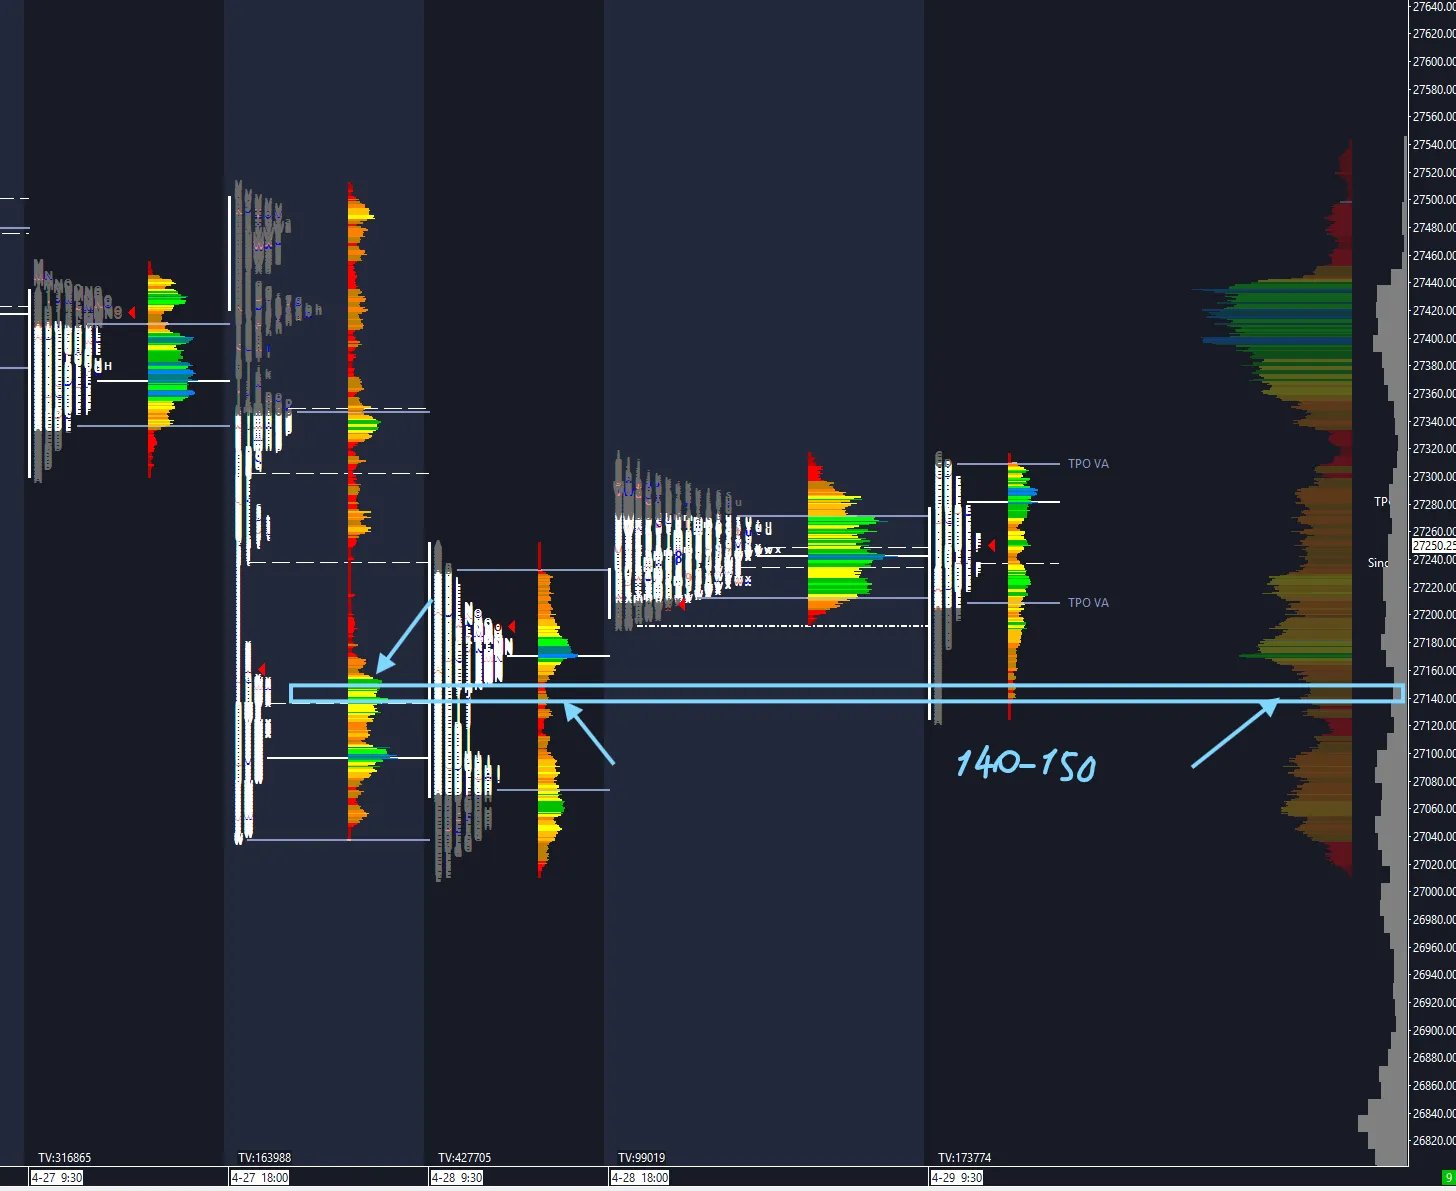
Then we look at the order flow that stacks up and the gamma area. The GEX area is a Major Put Volume wall at 27,135 — slightly lower than the volume profile area, which is not an issue; we want to be exact with the flow. Then you have heavy absorption on the red absorption candles and rejections right into the 27,135, which suggests we are trying to welcome and hold the passive buyers into price.
Ultimately this becomes the low of day (for the time being) and we target the 27,290–300 Major Call Volume wall above. You can see that the call wall then holds resistance for another move lower — ping pong between the two areas.
Overall GEX is a great tool. I've learned a lot and thoroughly enjoyed using it over the last several months and will continue to do so. The key is to not be blinded by GEX alone — hold your core strategy and use GEX to add confluence to your highest-conviction areas. Combine it with the EDGE Trading System and you have a framework that covers structure, volatility regime, and execution confirmation together.